Fig. 1.
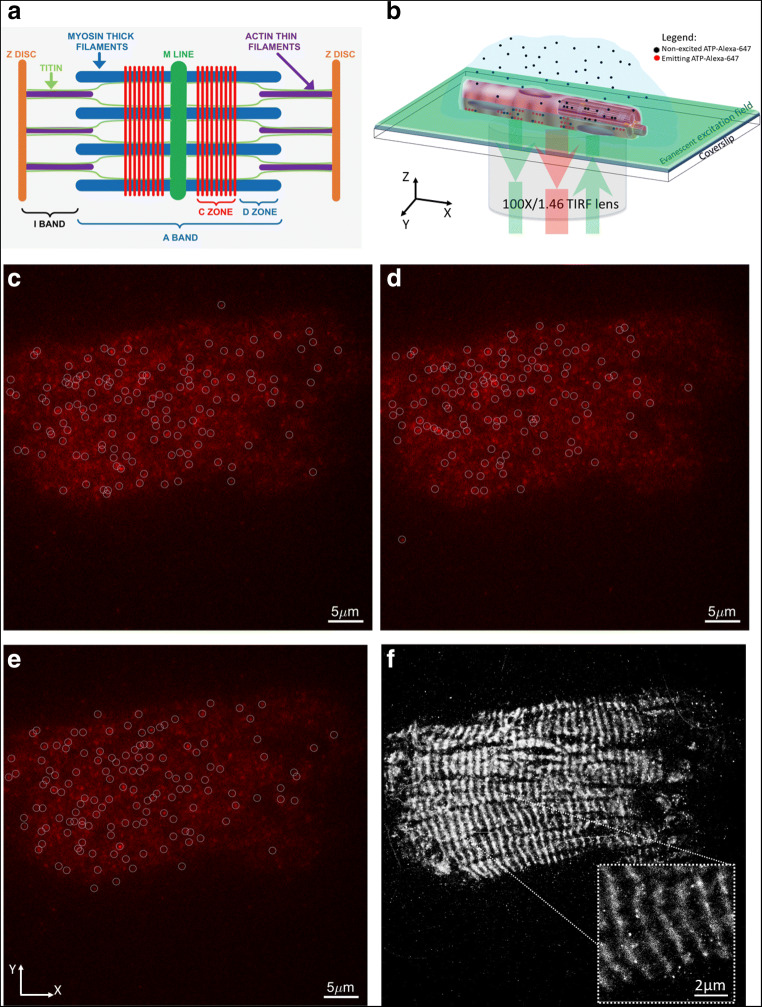
Example of ATP-Alexa-647 binding to fibril time series acquired using TIRF microscope. a A diagrammatic illustration of the cardiac sarcomere showing the Z discs (orange), the M line (dark green), the thin filaments (purple), myosin filaments (blue) and titin (light green). The nine red bars represent the location of cMyBP-C in the C-zone where it makes contact with the LMM portion of myosin and titin. The A band is central to the sarcomere but the I band, defined by the region containing only thin filament proteins, spans both sides of the Z disc and extends into the next sarcomere. b Schematic of TIRF setup with ATP-Alexa-647 binding and unbinding to the cardiomyocytes, while evanescent field excites only those within ~ 100–200 nm from the surface of the coverslip. Panels c, d, and e show 3 different frames from a 10 000 frames time series. At each frame, molecules (white circles) were detected above threshold signal-to-noise ratio of 6. f A single molecule localisation map obtained after combining centroids of all molecules detected in 10,000 frames

