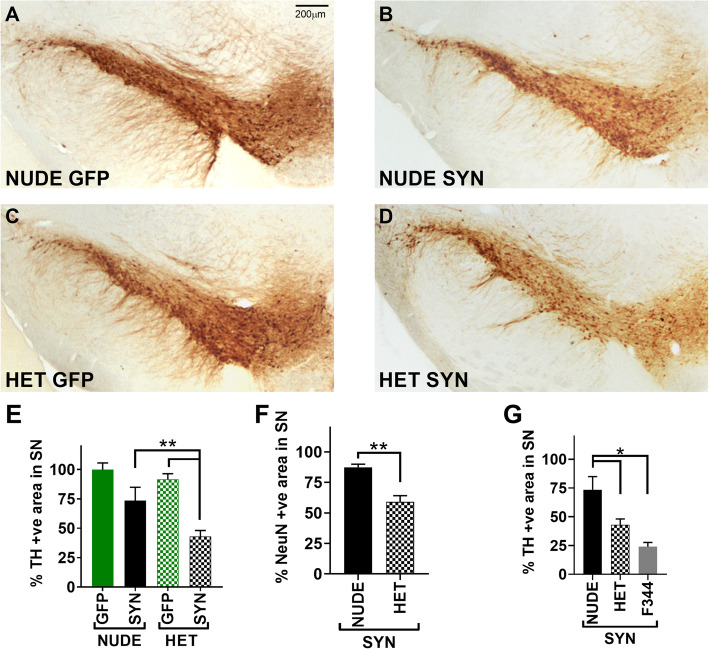
Fig. 2.
a-d Representative photomicrographs of TH (tyrosine hydroxylase—marker for dopamine neurons) staining in the substantia nigra (SN) region. a T cell deficient (nude) rats injected with AAV9-GFP (n = 10), b T cell deficient rats injected with AA9-human α-synuclein (αsyn) (n = 10), c T cell competent (heterozygous nude) rats injected with AAV9-GFP (n = 10), d T cell competent rats injected with AAV9-human α-synuclein (n = 10). e Bar graph shows the percentage area of positive cells in SNpc stained with TH by comparing the injected ipsilateral to the untreated contralateral side. A significant difference (two-way ANOVA p < 0.05; treatment: F (1, 32) = 23.12, p < 0.01; genetic background: F (1, 32) = 6.199, p < 0.05; post hoc analysis: Tukey’s multiple comparison test) of percentage positive cells was observed between the heterozygous nude rats injected with αsyn when compared to GFP injected controls. No significant difference was observed between the nude rats injected with αsyn compared to GFP. f Bar graph shows the percentage area of positive cells in SNpc stained with NeuN by comparing the injected ipsilateral to the untreated contralateral side for nude (n = 5) and heterozygous nude rats (n = 5) injected with α-syn. A significant difference (unpaired t test; p = 0.0026) in the percentage of NeuN+ cells was observed between the two groups. g Bar graph shows the percentage area of positive cells in SNpc stained with TH by comparing the injected ipsilateral to the untreated contralateral side for Fisher 344 (n = 10), heterozygous nude (n = 10), and nude rats (n = 10) injected with α-syn. A significant difference (one-way ANOVA p < 0.05; F (2, 24) = 10.02; post hoc analysis: Tukey’s multiple comparison test) in the percentage of TH+ cells was observed between groups. The bars in the graph represent mean ± standard error of the mean

