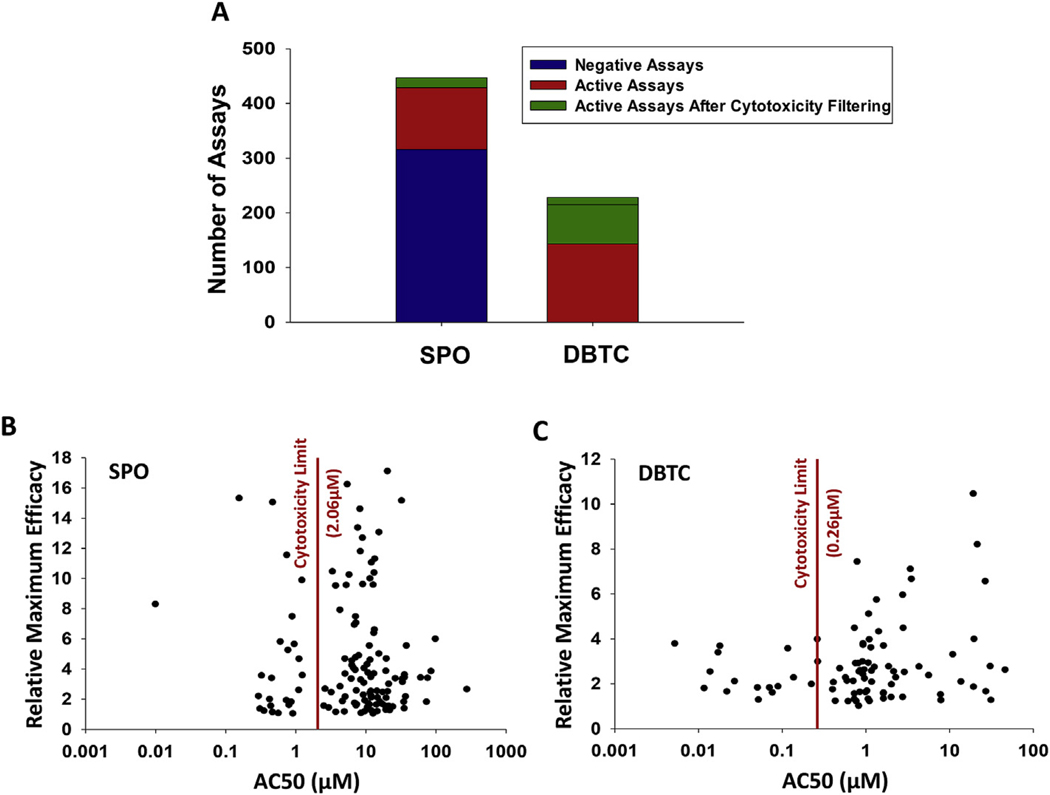
Fig. 3.
Summary of the ToxCast data for DBTC and SPO. Assay-specific data for both chemicals were pulled from the ToxCast Dashboard. A) ToxCast hit calls were used to define negative and active assays. Cytotoxicity filtering was done by applying the cytotoxicity limit as a cutoff value wherein assays having an AC50 below the cytotoxicity limit remained active after filtering. B, C) All assays determined to be active for either compound were plotted as AC50 versus the modlTp (maximum efficacy of modeled concentration-response curve) parameter from the ToxCast data, for each assay, with the cytotoxicity limit plotted as a straight line.

