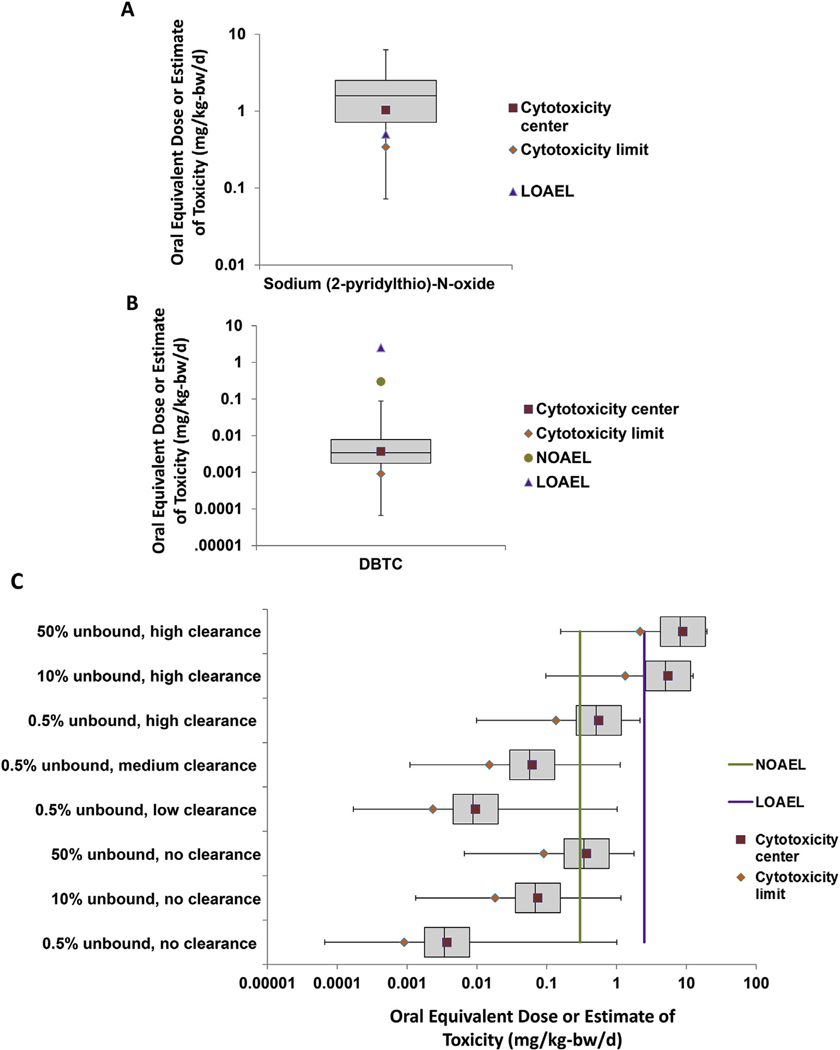
Fig. 4.
Comparison of ToxCast and Traditional Toxicology Data. ToxCast assay AC50 values were converted to oral equivalent doses (OED) and plotted as a distribution across the 5th, 25th, 50th, 75th, and 95th percentiles for all active assays for SPO and DBTC. The LOAEL/NOAEL values from the in vivo animal data, the cytotoxicity center, and cytotoxicity limit OEDs are plotted as point estimates. A) OEDs for SPO were determined using available toxicokinetic data. B) OEDs for DBTC were determined using the worst-case toxicokinetic parameter estimates. C) For DBTC, a range of toxicokinetic parameter estimates were used to determine OEDs from the AC50 values for the 5th, 25th, 50th, 75th, and 95th percentiles of all active assays, the cytotoxicity limit, and the cytotoxicity center. The in vivo NOAEL and LOAEL data are plotted as point estimates shown as green and purple lines respectively. (For interpretation of the references to color in this figure legend, the reader is referred to the Web version of this article.)

