
Figure EV1. RGC synaptic inputs were labeled by PSVue.RGC synaptic inputs were labeled by PSVue.
-
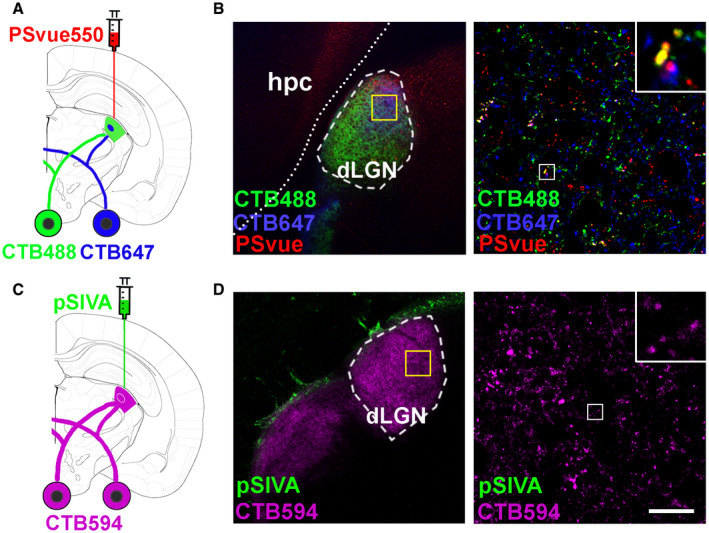
AA diagram illustrating PS labeling by PSvue550 and RGC inputs anterograde tracing by CTB. CTB was intraoccularly injected 24 h prior to PSVue/pSIVA injection.
-
BLeft panel shows well‐diffused PSVue into dLGN. The yellow box indicates the region where the images were taken. Right panel shows RGC inputs colocalize with PSVue signal. The white box indicates the region of higher magnification image shown.
-
CA diagram showing pSIVA labeling and RGC inputs tracing by CTB.
-
DLeft panel shows pSIVA accumulated in the border between hippocampus and LGN. Right panel shows minimal pSIVA colocalized with RGC inputs. Scale bar, 20 μm.