-
A
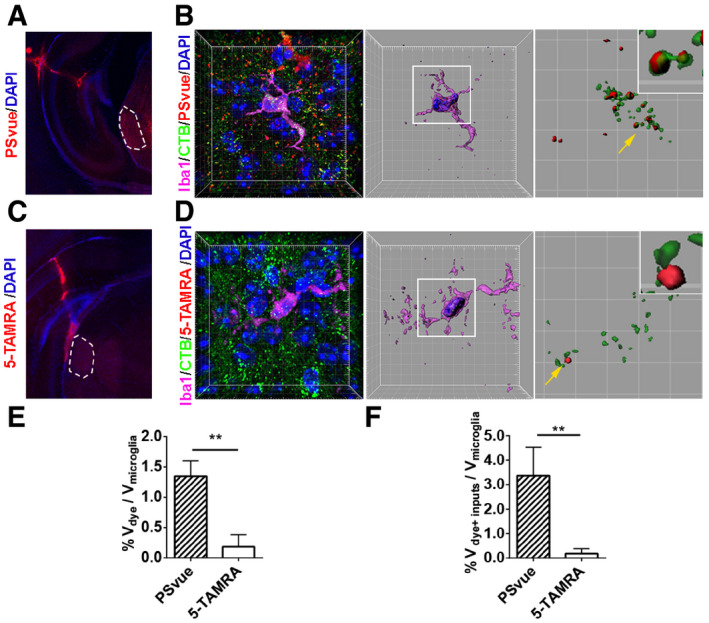
An image shows the PSVue signal after intracranial injection. Dotted areas indicate the dLGN.
-
B
A representative image of microglia from PSVue treated dLGN. Nuclei were labeled with DAPI. The mid‐panel shows a 3D surface rendered microglia (purple) with DAPI (blue) and engulfed inputs (green) and PSVue (red). The right panel shows engulfed RGC inputs and PSVue inside of microglia. The magnified insert shows PS+ RGC inputs.
-
C
An image shows the 5‐TAMRA signal after injection. Dotted areas indicate the dLGN.
-
D
A representative image of microglia from 5‐TAMRA treated dLGN. Very few 5‐TAMRA puncta were observed. The middle panel shows a surface rendered microglia with engulfed inputs (green) and 5‐TAMRA (red). The right panel shows engulfed RGC inputs and 5‐TAMRA. The insert shows RGC inputs do not overlap with 5‐TAMRA.
-
E
Quantification of engulfed PSVue and 5‐TAMRA dyes by microglia. N = 4 (PSVue), N = 3 (5‐TAMRA), **P = 0.001.
-
F
Quantification of engulfed PSVue‐positive or 5‐TAMRA‐positive RGC inputs by microglia. N = 4 (PSVue), N = 3 (5‐TAMRA), **P = 0.006.
‐test. Data are presented as mean ± SD.

