-
A
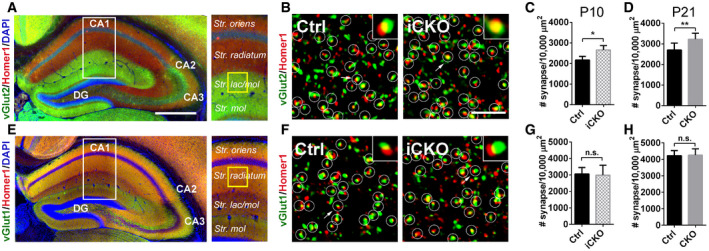
Representative images show hippocampal vGlut2 and Homer1 immunostaining. White box outlines the region of interest and yellow box shows the regions where confocal images were taken. Scale bar, 500 μm.
-
B
Confocal images of synaptic immunostaining in CA1 striatum lacunosum‐moleculare (str. lac/mol) at P10. Arrows pointing to the enlarged synapse in the insets. Scale bar, 5 μm.
-
C, D
Quantification of synapse density in CA1 str. lac/mol in iCKO versus control at P10 (C), and CKO versus control at P21 (D). At P10, N(Ctrl) = 4, N(iCKO) = 3, P = 0.02. At P21, N = 8, P = 0.005.
-
E
Representative images show hippocampal vGlut1 and Homer1 immunostaining.
-
F
Confocal images of synaptic immunostaining in CA1 striatum radiatum at P10.
-
G, H
Quantification of synapse density in CA1 striatum radiatum in iCKO versus control at P10 (G), and CKO versus control at P21 (H). At P10, N = 5, P = 0.83. At P21, N = 5, P = 0.89.
‐test. All data are presented as mean ± SD.