
Figure EV3. In vivo PS exposure is not downstream of activated caspase 3.
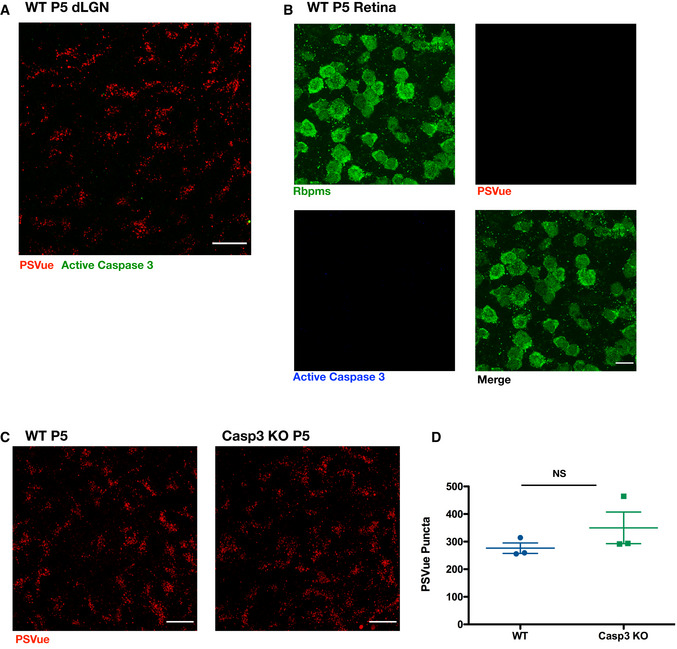
- Representative max intensity image of the dLGN following injection with PSVue 24 h prior in WT P5 C57/Bl6 mice. IHC for active caspase 3 was performed. Images taken at 63× magnification; scale bar represents 15 μm.
- Representative images of retinal whole mounts of WT P5 C57/Bl6 mice following injection with PSVue 24 h prior. IHC for the pan‐RGC marker Rpbms and active caspase 3 was performed. Images taken at 63× magnification; scale bar represents 15 μm.
- Representative max intensity images of the dLGN following injection with PSVue 24 h prior in WT or caspase 3 knockout (KO) P5 littermates. Images taken at 63× magnification; scale bar represents 15 μm.
- Quantification of PSVue in the dLGN of WT or caspase 3 KO P5 littermates injected with PSVue 24 h prior. Data represent the mean per animal ± SEM; N = 3; WT: 276.4 ± 19.01 vs. caspase 3 KO: 349.9 ± 57.29. P = 0.2904, unpaired t‐test.
Source data are available online for this figure.