
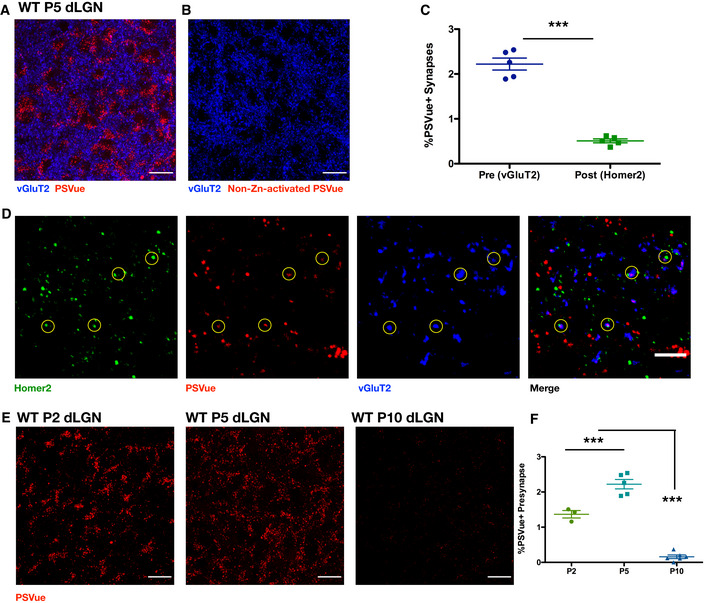
Figure 4. In vivo exposed PS is developmentally regulated across periods of pruning in the visual system.
-
A, BRepresentative max intensity images of the dLGN following injection with either PSVue (A) or non‐zinc‐activated PSVue (B) in WT P4 C57/Bl6 mice 24 h prior. IHC for the presynaptic marker vGluT2 was performed. Images taken at 63× magnification; scale bar represents 15 μm.
-
CQuantification of PSVue co‐localization at synapses in the dLGN of WT P5 mice injected with PSVue 24 h prior. Data represent the mean per animal ± SEM; N = 5 PSVue + presynaptic: 2.22% ± 0.134 vs. PSVue + postsynaptic: 0.51% ± 0.043. ***P < 0.0001, paired t‐test.
-
DRepresentative images of presynaptic (vGluT2) and postsynaptic (Homer2) IHC performed in the dLGN of WT P5 animals following PSVue injection 24 h prior. Synapses were identified through co‐localization of pre‐ and postsynaptic markers in CellProfiler. Circles indicate synapses where PSVue co‐localization was observed. Images taken at 63× magnification; scale bar represents 5 μm.
-
ERepresentative max intensity images of the dLGN following injection with PSVue 24 h prior in WT P2, P5, and P10 C57/Bl6 mice. Images taken at 63× magnification; scale bar represents 15 μm.
-
FQuantification of PSVue co‐localization with vGluT2 at synapses in the dLGN of WT P2, P5, and P10 C57/Bl6 mice injected with PSVue 24 h prior. Data represent the mean per animal ± SEM; N = 3 (P2), N = 5 (P5), N = 6 (P10); P2: 1.36% ± 0.105 vs. P5: 2.22% ± 0.134 vs. P10: 0.16% ± 0.050. ***P < 0.0001, one‐way ANOVA with Tukey's multiple comparison test.
Source data are available online for this figure.