
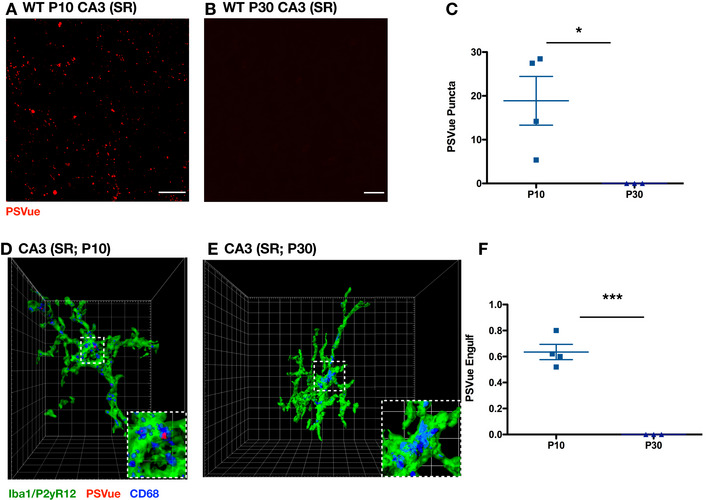
Figure EV4. Developmental PS exposure and engulfment in CA3.
-
A, BRepresentative max intensity images of CA3 SR following injection with PSVue 24 h prior in WT P10 (A) and P30 (B) C57/Bl6 mice. Images taken at 63× magnification; scale bar represents 15 μm.
-
CQuantification of PSVue in CA3 SR of WT P10 and P30 C57/Bl6 mice injected with PSVue 24 h prior. Data represent the mean per animal ± SEM; N = 4 (P10), N = 3 (P30); P10: 18.88 ± 5.55 vs. P30: 1.50e−5 ± 8.386e−6. *P = 0.0349, unpaired t‐test.
-
D, ERepresentative Imaris surface‐rendered images of microglia in CA3 SR following injection with PSVue 24 h prior in WT P10 (D) and P30 (E) C57/Bl6 mice. Microglia are labeled by IHC with Iba1 and P2yR12, and lysosomes are labeled with CD68. Images taken at 63× magnification.
-
FQuantification of the volume of engulfed PSVue material in CA3 microglia analyzed from WT P10 and P30 C57/Bl6 mice injected with PSVue 24 h prior. Data represent the mean of 15–20 microglia per animal ± SEM; N = 4 (P10), N = 3 (P30); P10: 0.635% ± 0.059 vs. P30: 1.033e−5% ± 6.386e−6. ***P = 0.0003, unpaired t‐test.
Source data are available online for this figure.