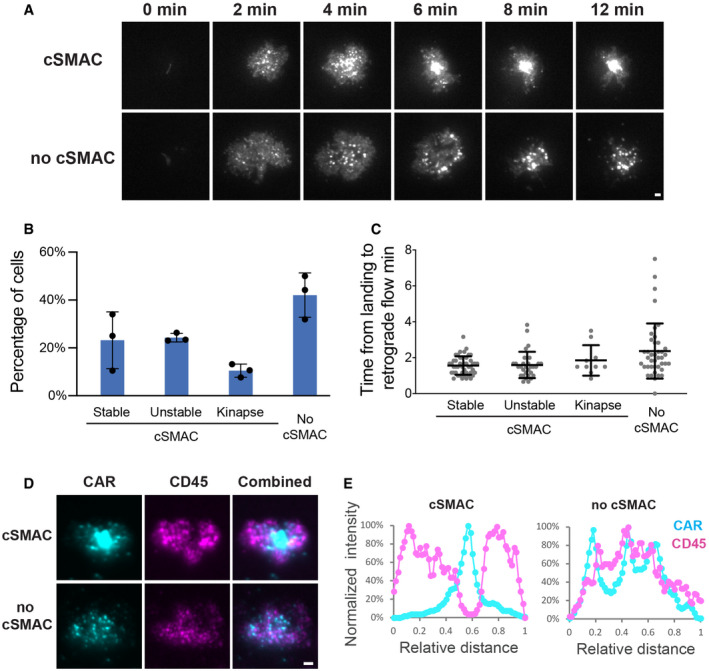
T cells expressing GFP‐CAR were plated on CD19 and ICAM‐1‐coated SLBs. TIRF microscopy was implemented to visualize CAR localization.
CAR microclusters underwent centripetal movement to form cSMAC (upper panel) or remained separated (lower panel).
Quantification of the categories regarding the formation of CAR cSMAC. Unstable cSMACs are defined by a cSMAC duration below 12 min. Data are shown as mean ± SD. n = 3 independent experiments. 37, 38, and 47 cells were quantified in individual experiments.
Quantification of time from cell landing to the start of retrograde flow. Data are shown as mean ± SD. n = 33 (stable), 31 (unstable), 10 (kinapse), and 41 (no cSMAC) cells. Results are pooled from three independent experiments.
Localization of CAR and CD45 in the immunological synapse. CAR T cells were fixed 20 min after being plated on the SLB, followed by staining with an anti‐CD45 antibody.
Line scan of CAR and CD45 across the long axis of the immunological synapse. Shown is the normalized fluorescence intensity.
Data information: Scale bar: 2 μm.

