-
A, B
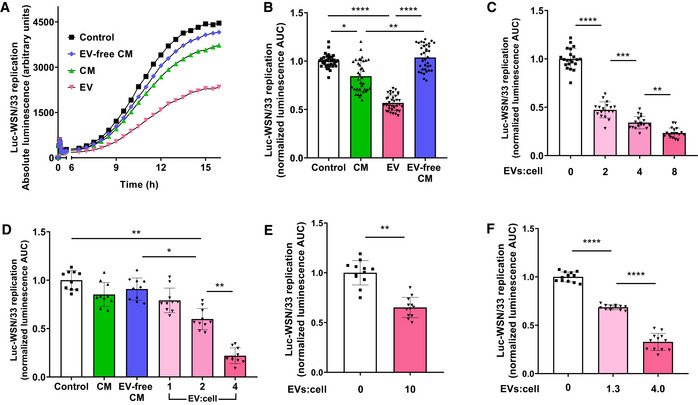
MDCK‐SIAT1 cells co‐incubated with Luc‐WSN/33 and MH‐S CM fractions. Replication was quantified by luminescence. (A) Replication curves display average luminescence reads from 5 wells per condition (measured at 7.5 min intervals—displayed here at 30 min intervals) from 1 experiment representative of 7 independent experiments. (B) Mean calculated area under the luminescence curves (AUC) for individual wells normalized to the corresponding mean of the control condition from these 7 experiments.
-
C
Luc‐WSN/33 replication in MDCK‐SIAT1 cells incubated with flow cytometry‐quantified MH‐S AM‐EVs at specified EV:cell ratios.
-
D
Luc‐WSN/33 replication in MDCK‐SIAT1 cells incubated with CM fractions of J2 retrovirus‐immortalized primary mouse AMs.
-
E
Luc‐WSN/33 replication in MDCK‐SIAT1 cells incubated with primary rat AM‐derived EVs.
-
F
Luc‐WSN/33 replication in MDCK‐SIAT1 cells incubated with human THP‐1 macrophage‐derived EVs.
Data information: Luc‐WSN/33 replication in each condition represented by mean luminescence AUC for individual wells normalized to the mean of the control condition from 3 (C–E) and 4 (F) independent experiments. Error bars = SD. One‐way ANOVA (B–D, F) and unpaired Student's
t‐test (E) (*
P value of < 0.05, **
P < 0.01, ***
P < 0.001, ****
P < 0.0001).
Source data are available online for this figure.

