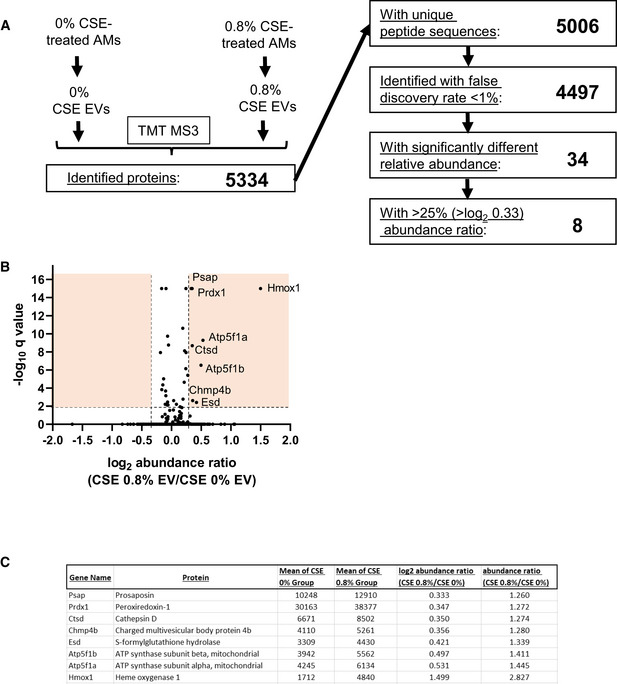
Figure EV3. Differential abundance of proteins within AM‐EVs in response to CSE .

- Flowchart demonstrating the number proteins within each EV condition compared using TMT‐MS and each of the listed criteria.
- Volcano plot of all 4,497 proteins identified in both EV conditions. Orange boxes collectively denote the proteins with significantly different relative abundance (a −log10 q value ≥ 2) and with > 25% difference in abundance ratio.
- List of the 8 proteins identified that exhibited > log2 0.33 in abundance in EVs isolated from 0.8% CSE‐treated AMs compared to 0% CSE‐treated AM‐EVs.
