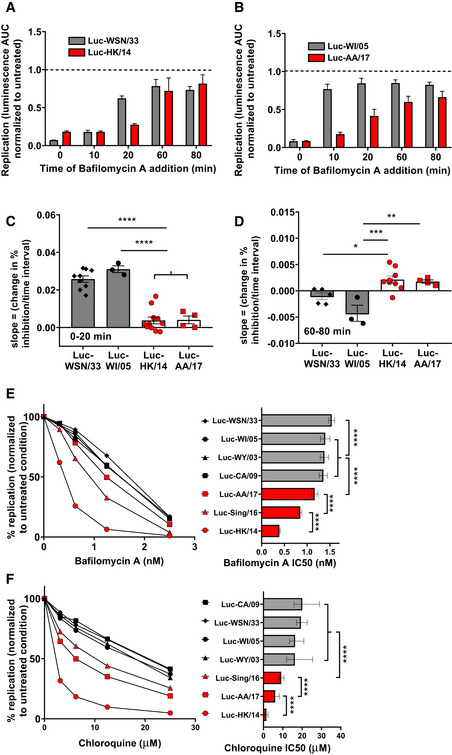
Figure 6. Influenza strains susceptible to inhibition by AM‐EVs escape endosomes early and are resistant to inhibitors of endosomal acidification.

-
A–DReplication assessed by luminescence following 10 nM Baf‐A1 addition at the indicated times following synchronized uptake of bound Luc‐expressing virions. (A, B) Shown are examples from 1 experiment representative of a total of 3–11 independent experiments per strain. Data represent mean luminescence AUC normalized to the mean of the corresponding strain incubated in 0.1% DMSO (dashed line). (C, D) The kinetics of endosomal escape by Luc‐WSN/33 and HK/14 strains are depicted by the loss of inhibition by high dose Baf‐A1 between (C) 0–20 min and (D) 60–80 min. Data represent mean slope (change in % inhibition/time interval) from 5 wells per plate from 3 to 11 independent experiments.
-
E, FShown are dose response curves (left) and corresponding IC50 values (right) for effects of the endosomal acidification inhibitors (E) Baf‐A1 and (F) Chl on replication of Luc‐expressing strains. Curves display mean luminescence AUC expressed as a percentage of replication of corresponding strains in control conditions from 3 to 5 independent experiments (mean of 3 wells per condition) for each strain and inhibitor concentration. Bar graphs depict mean IC50 values from these experiments.
