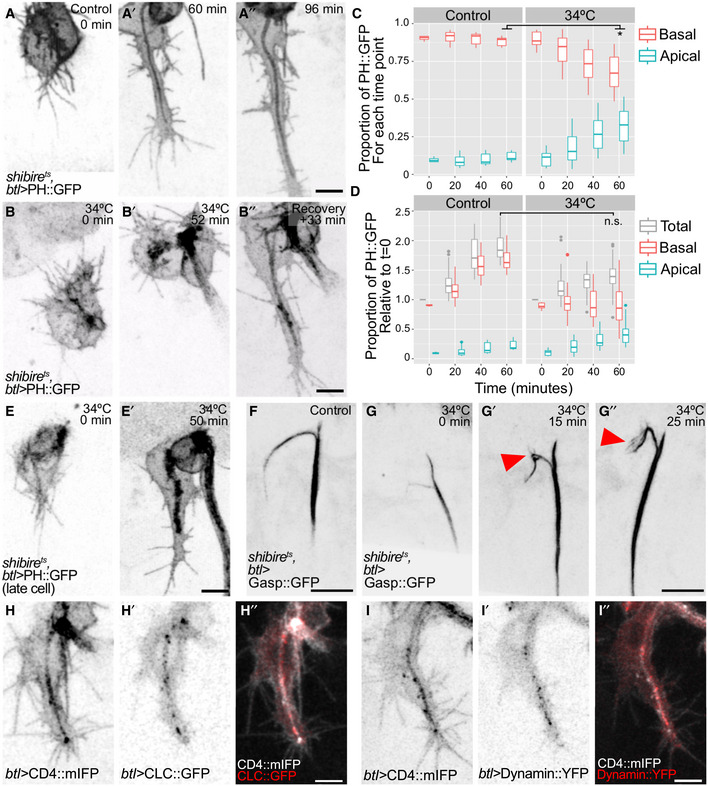
A–EDistribution of the plasma membrane reporter PH::GFP in control cells (A–A″) and in cells where dynamin activity had been blocked using a temperature‐sensitive allele of dynamin (shibire
ts, B, E). In (B), it was inactivated at the onset of tube formation, whereas in (E), it was inactivated ˜15 min after the tube had begun to form. (C–D) Distribution of PH::GFP fluorescence intensity in control and shibire
ts cells. Data from 1‐ to 2‐min interval time lapses were collected in windows of 20 min each (except for t = 0). Box plots represent median, interquartile range (IQR) and IQR*1.5 below and above the IQR. (C) Proportion of signal in the apical and in the basal membrane compartment over time in control cells (n = 4) and also in cells where dynamin was inactivated (n = 5), *P = 0.015, Mann–Whitney U‐test. (D) Total fluorescence intensity of PH::GFP over time in controls (n = 4) and in cells where dynamin was inactivated (n = 5), n.s.: P = 0.063, Mann–Whitney U‐test.

