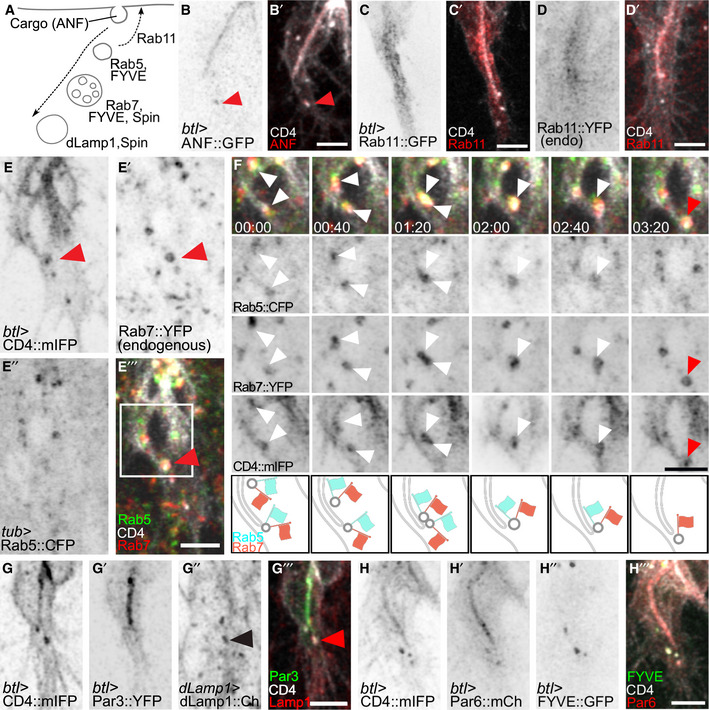
Figure EV4. Distribution of late endosomal markers during terminal cell growth.

-
A–DTerminal cells expressing CD4::mIFP under btl‐gal4, together with markers of different compartments (summarized in A): (B) ANF::GFP; red arrowheads: a CD4::mIFP vesicle that carries ANF::GFP; (C) Rab11::GFP under btl‐gal4, (D) Endogenously YFP‐tagged Rab11.
-
E, FCell expressing CD4::mIFP under btl‐gal4, Rab5::CFP under direct control of the tubulin promoter and endogenously tagged Rab7::YFP. (F) shows the area marked by the box in (E‴) at higher magnification and at six time points. White arrowheads: Rab5‐positive, Rab7‐positive CD4::mIFP vesicles; red arrowhead: Rab5‐negative, Rab7‐positive CD4::mIFP vesicle. A diagrammatic interpretation of the experiment shown in (E‐E‴) is shown below.
-
G, HTerminal cells expressing CD4 together with (G) Par3::YFP and dLamp1::mCherry under its own promoter and (H) with Par6::mCherry and FYVE::GFP. Black and red arrowheads point to dLamp1::mCherry in a CD4 vesicle.
