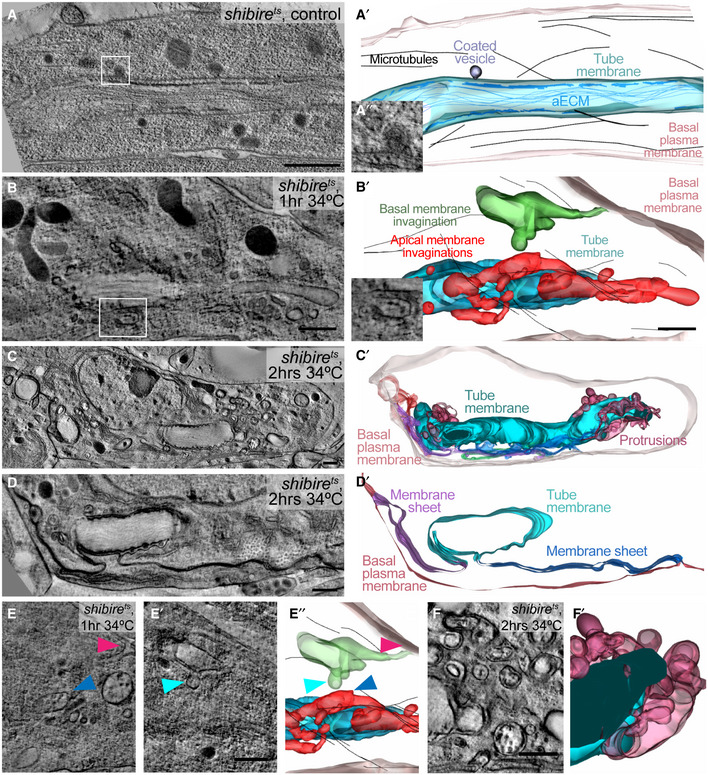
Figure 5. Effects of dynamin inactivation on membrane morphology.

-
A–FTEM tomograms and 3D reconstructions of terminal cells in shibire ts embryos. (A) Control. (B‐F) Kept at 34°C for 1 (B, E) or for 2 h (C, D, F). Boxed regions in (A) and (B) are magnified in (A″) and (B″). (A′, B′) Reconstructed 3D models. The tube membrane (cyan) is characterized by the electron‐dense apical extracellular matrix (aECM). Invaginations with connections that can be traced to the tube membrane are red, and invaginations from the basal plasma membrane are green. The basal membrane is light pink. (C‐D′) shibire ts terminal cell after 2 h at 34°C. (C′) 3D reconstruction, colour coding for basal and tube membrane is the same as above. Membrane that is continuous with both the apical and the basal membrane is shown in green, purple and dark blue. (D‐D′) Higher magnification of a region in the same cell at a level where membrane sheets (purple and dark blue) bridge the apical and basal plasma membrane domains. (E‐E″) Two focal planes and model of a tomogram from the cell shown in (B) where a basal (pink arrowhead) and an apical invagination (blue) are seen in close proximity (closest distance is marked by cyan and blue arrowheads). (F‐F′) Apical membrane overgrowth regions of the cell shown in (C). The genotype of the embryos was shibire ts ; btl>KDEL::RFP, Par3::YFP. The cell shown in (C–D) was found and acquired without the CLEM approach.
