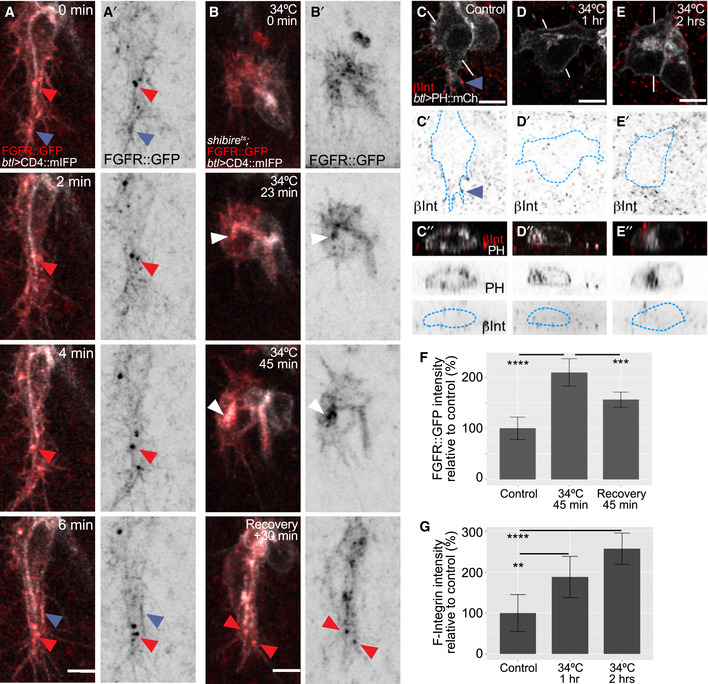
Figure 6. Effect of dynamin inactivation on the distribution of basal proteins.

-
A, BTerminal cells expressing the membrane marker CD4::mIFP under btl‐gal4 and FGFR::GFP under its own promoter (from the fTRG library). (A) Time lapse imaging of a control cell. Blue arrowheads point to filopodia and basal plasma membrane, and red ones point to puncta containing CD4::mIFP and FGFR::GFP. (B) shibire ts cell imaged before dynamin inactivation, after 23 and 45 min of inactivation, and after 30 min of recovery. White arrowheads point to FGFR::GFP accumulation at the apical compartment.
-
C–ESingle confocal planes of terminal cells expressing PH::mCherry and stained for βPS‐integrin. The outline of the cells was traced using the PH::mCherry signal and is shown as a blue dashed line. (C) Control. Blue arrowheads: βPS‐integrin signal in filopodia. (D) 1 h at 34°C; (E) 2 h at 34°C. (C″–E″) Orthogonal views of the lines shown in white in (C–E).
-
F, GQuantification of fluorescence intensity from stained embryos of FGFR::GFP (F) and of βPS‐integrin (G). Data are plotted as mean ± SD; significance was assessed using one‐way ANOVA with Dunnett's correction for multiple comparisons. **P = 0.0022, ***P = 0.0003, ****P < 0.0001. Number of cells analysed for (F): control, n = 8; 1 h at 34°C, n = 6; recovery, n = 8. (G). For (G): control, n = 7; 1 h at 34°C, n = 8; 2 h at 34°C, n = 8.
