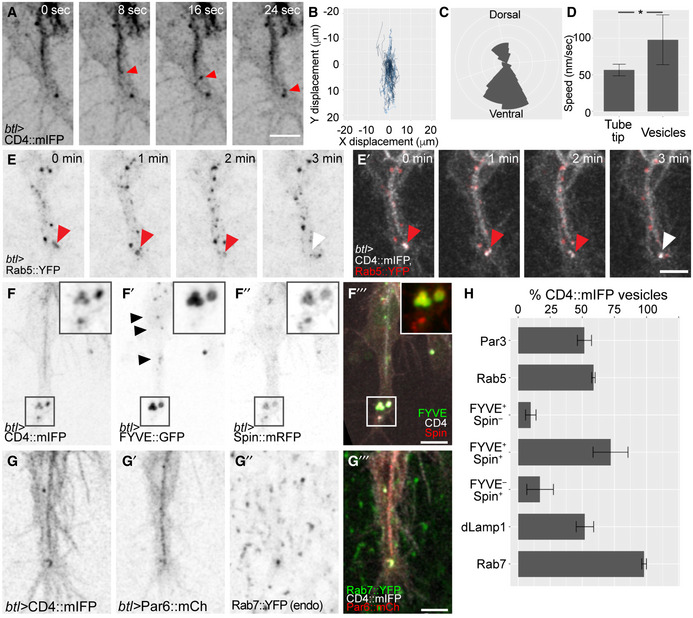
E–HTerminal cells expressing the membrane reporter CD4::mIFP together with markers for vesicles of the endocytic pathway. (E) Rab5::YFP, red arrowheads point to a Rab5‐positive vesicle; the white arrowhead shows the same vesicle once it lost the Rab5 signal. (F) FYVE::GFP, a PI3P reporter; and Spin::mRFP, a lysosomal marker. Black arrowheads point to small FYVE::GFP vesicles, and the squared area shows large ones at the tip. (G) Par6::mCherry and endogenously labelled Rab7::YFP. (H) Percentage of CD4::mIFP vesicles that carry the indicated markers. Data are plotted as mean ± SD. For each marker, we analysed at least 20 min of cell growth with 10–20 time points. Number of cells analysed: Par3, n = 2; Rab5, n = 3; FYVE::GFP, n = 4; FYVE::GFP‐Spin::RFP (which includes single‐ and double‐positive vesicles), n = 3; dLamp1, n = 2; Rab7, n = 5.

