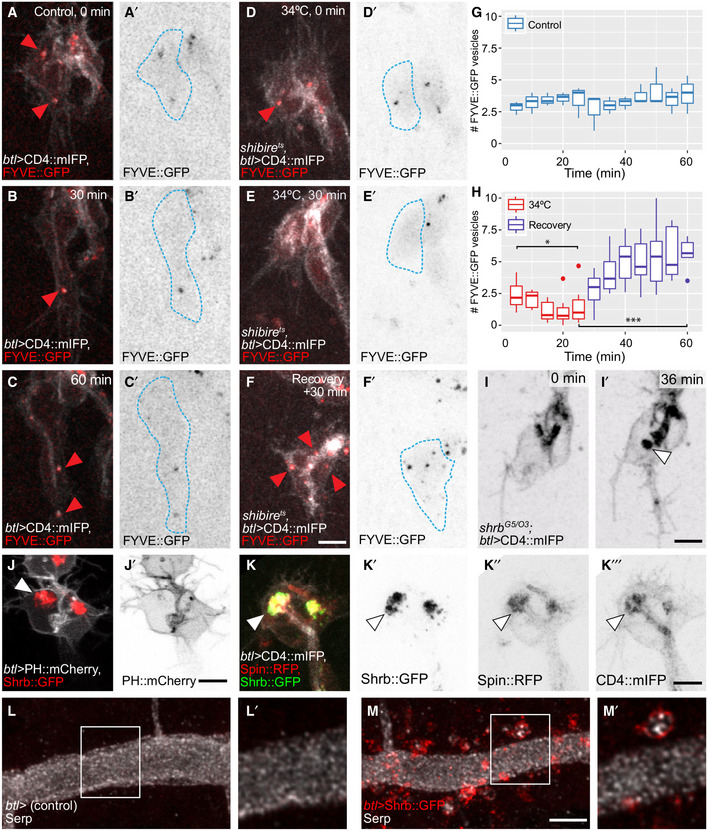
Figure 8. Distribution of late endosomal markers upon disruption of the endocytic pathway.

-
A–FTerminal cells expressing CD4::mIFP and FYVE::GFP under btl‐gal4. The outline of the cells was traced using the CD4::mIFP signal and is shown as a blue dashed line. (A–C) Control cell. (D–F) shibire ts cell before 34°C (D), after 30 min at 34°C (E) and after 30 min of recovery (F). Red arrowheads: FYVE::GFP puncta.
-
G–HNumber of FYVE::GFP vesicles in 4 control cells (G) and in 6 shibire ts cells (H). Box plots represent median, interquartile range (IQR) and IQR*1.5 below and above the IQR. Significance in (H) was assessed using one‐way ANOVA with Geisser–Greenhouse correction for paired data and Dunnett's multiple comparison test. *P = 0.0288, ***P = 0.0016.
-
Ishrb O3/G5 mutant cell expressing CD4::mIFP under btl‐gal4. Arrowhead: CD4::mIFP aggregation.
-
J, KTerminal cells overexpressing Shrb::GFP under btl‐gal4 together with PH::mCherry (J) or together with Spin::RFP and CD4::mIFP (K). Arrowheads: Shrb::GFP accumulations.
-
L, MDorsal trunk cells stained for Serp. In control embryos (L), Serp is seen exclusively in the tracheal lumen. The cells themselves are not visible in these images. In embryos expressing Shrb::GFP under btl‐gal4 (M), Serp is also seen inside the cells, usually in association with or surrounded by Shrb::GFP. Boxed regions are magnified in (L′‐M′) and shown as single confocal planes.
