-
A
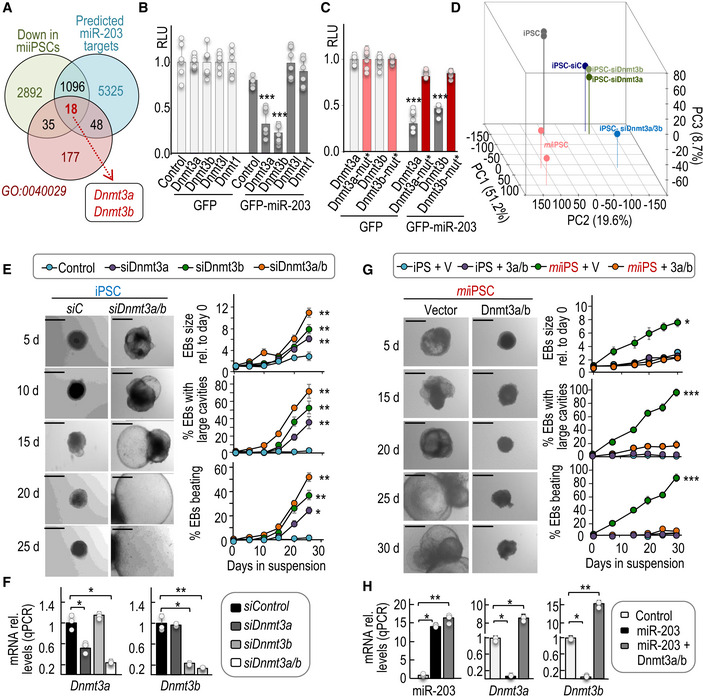
Venn diagrams representing common genes downregulated in
miiPSCs, predicted as miR‐203 targets, and also involved in the epigenetic regulation of gene transcription (GO:0040029). The list of the common 18 transcripts (including
Dnmt3a and
Dnmt3b) is presented as
Appendix Table S2.
-
B, C
Relative luciferase units (RLU; normalized to Renilla luciferase and relative to DNA amount) in 293T cells transfected with DNA constructs carrying the wild‐type 3′‐UTRs from the indicated transcripts (B) or the mutated versions of Dnmt3a and Dnmt3b 3′‐UTRs, downstream of the luciferase reporter (C). Cells were co‐transfected with Renilla luciferase as a control of transfection, and a plasmid expressing GFP or miR‐203‐GFP. Data are represented as mean ± SD (n = 3 independent experiments).
-
D
Principal component analysis from RNAseq data including profiles from wild‐type iPSCs, miiPSCs, and wild‐type iPSCs transfected with either control siRNAs (siC), or siRNAs specific against Dnmt3a (siDnmt3a), Dnmt3b (siDnmt3b), or both (siDnmt3a/b).
-
E
Representative images of embryoid bodies (EBs) derived from wild‐type iPSCs in which the expression of Dnmt3a and Dnmt3b was transiently repressed by siRNAs. Scale bars, 500 μm. Plots show the quantification of the size of EBs and the percentage of EBs with large cavities or beating at different time points during the differentiation process. Data are represented as mean ± SEM (n = 3 independent experiments).
-
F
Expression levels of Dnmt3a or Dnmt3b transcripts after transfection of wild‐type iPSCs with specific siRNAs either against Dnmt3a, Dnmt3b, or a combination of both (Dnmt3a/b) (as indicated in E). RNA expression was measured 24 h after the transfection protocols and was normalized by GAPDH mRNA levels. Data are represented as mean ± SEM (n = 3 independent experiments).
-
G
Representative images of EBs derived from miiPSCs that were transiently and simultaneously transduced with Dnmt3a and Dnmt3b cDNAs or empty vectors, and simultaneously treated with Dox to induce miR‐203 expression. Scale bars, 500 μm. Plots show the quantification of EB size, percentage of EBs with large cavities, and beating EBs at different time points during differentiation. Data are represented as mean ± SEM (n = 3 independent experiments).
-
H
Expression levels of miR‐203, Dnmt3a, or Dnmt3b transcripts in iPSCs after induction of miR‐203 (miiPSCs) and transduced with Dnmt3a and Dnmt3b cDNAs or empty vectors (as indicated in G). RNA expression was measured 24 h after the transfection protocols and was normalized by a control miRNA (miR‐142) or GAPDH mRNA, respectively. Data are represented as mean ± SEM (n = 3 independent experiments).
‐test).

