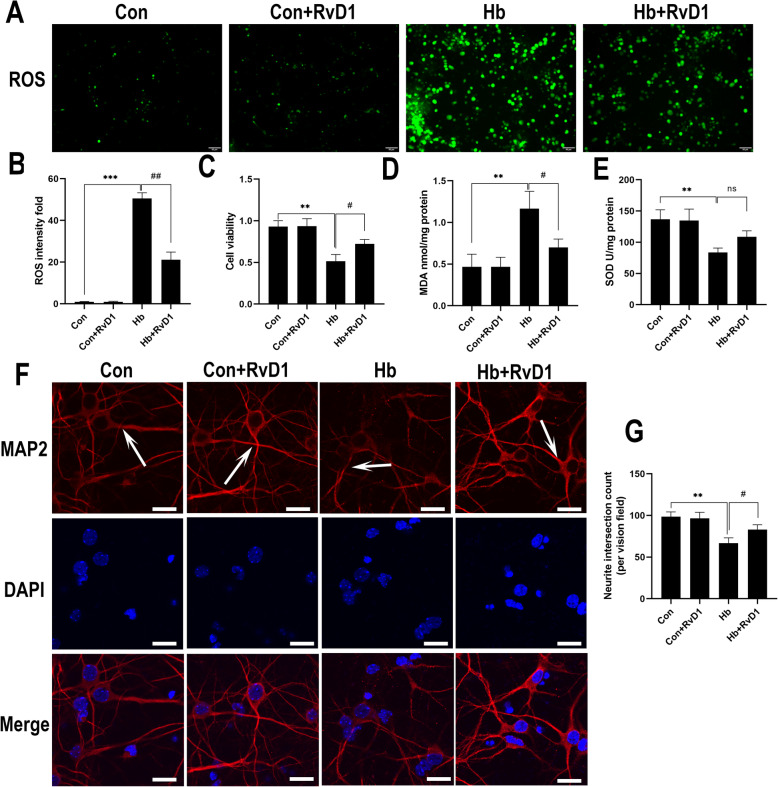
Fig. 7.
Effects of RvD1 on the oxidative stress and synaptic growth of neurons. The primary neurons were cultured in medium containing 50 μM Hb for 24 h, and RvD1 was added at a concentration of 25 nM 30 min before Hb stimulation. a, b The production of ROS in neurons and the statistical results for each group (n = 3). c The activity of neurons was measured by the CCK-8 method (n = 6). d, e MDA content and SOD activity (n = 3). f The synapse changes of neurons, shown as white arrows. g The number of synaptic intersections in the visual field analyzed by ImageJ (n = 5). The data were analyzed by one-way ANOVA and Tukey’s post hoc multiple comparison. **p < 0.01, ***p < 0.001, #p < 0.05, and ##p < 0.01. Bar = 50 μm for ROS staining and 40 μm for MAP2 staining. n is the number of independent cell samples

