
. 2020 Aug 7;2020:6214363. doi: 10.1155/2020/6214363
Copyright © 2020 Heba E. Hashem et al.
This is an open access article distributed under the Creative Commons Attribution License, which permits unrestricted use, distribution, and reproduction in any medium, provided the original work is properly cited.
Figure 5.
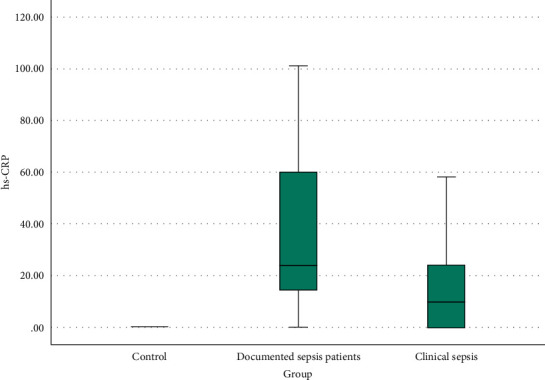
CRP box plot among the three studied groups.