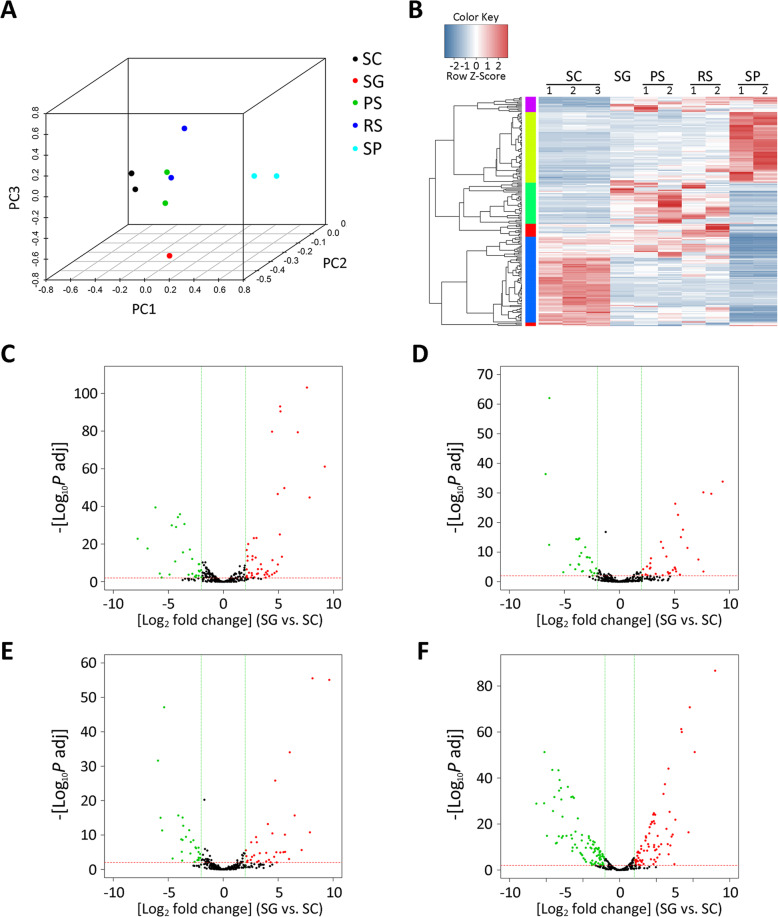
Fig. 2.
Analysis of miRNAs expression in SC, SG, PS, RS and sperm (SP). (A) Principal components explain the correlation among SC, SG, PS, RS, SP. (B) Heatmap comparing miRNAs’ expression among SC, SG, PS, RS and SP. (C) Scatter plot between SG and SC. (D) Scatter plot between PS and SC. (E) Scatter plot between RS and SC. (F) Scatter plot between RS and SC. Standard selection criteria to identify differentially expressed genes was established at Padj < 0.01; the log2 fold change > 2 were expressed as up genes (red dots), log2 fold change < − 2 were expressed as down genes (green dots)

