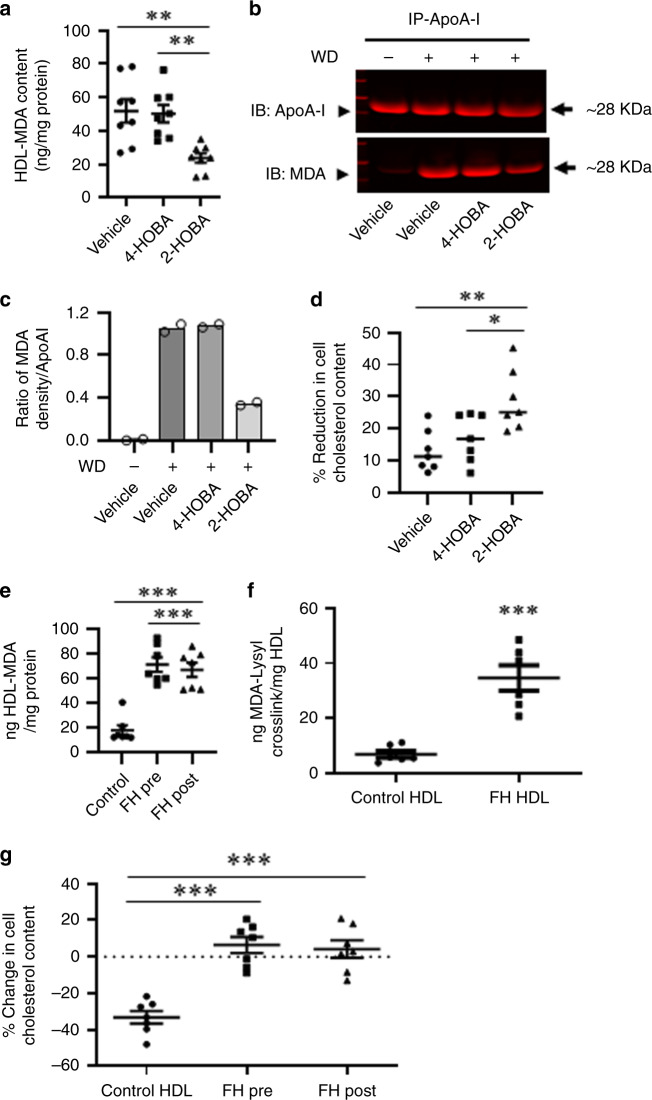
Fig. 7. Effects of 2-HOBA on MDA-HDL adducts and HDL function.
a The levels of MDA adducts were measured by ELISA in HDL isolated from Ldlr−/− mice treated as described in Fig. 1. n = 8 biologically independent mice per group. Data are presented as mean ± SEM. One-way ANOVA with Bonferroni’s post hoc test, p values of 2-HOBA vs vehicle and 2-HOBA vs 4-HOBA are **0.0031 and **0.0053. Western blots (b) and quantitation (c) of apoAI and MDA-apoAI in HDL isolated from plasma by immunoprecipitation using primary anti-apoAI antibody. Ldlr−/− mice were treated as described in Fig. 1 and apoAI and MDA-apoAI from Ldlr−/− mice consuming a chow diet are included for comparison. Plasma was pooled from three mice per group from 2 experiments. c Quantitation of the mean density ratio (arbitrary units) of MDA-apoAI to ApoAI was done using ImageJ software n = 2 biologically independent experiments per group. Data are presented as the mean. d The HDL was isolated from the plasma of Ldlr−/− mice consuming a western diet for 16 weeks and treated with 2-HOBA or 4-HOBA or vehicle. Cholesterol-enriched macrophages were incubated for 24 h with HDL (25 μg protein/ml), and the % reduction in cellular cholesterol content measured. n = 7 biologically independent mice per group. Data are presented as mean ± SEM. One-way ANOVA with Bonferroni’s post hoc test, p values of 2-HOBA vs vehicle and 2-HOBA vs 4-HOBA are **0.0046 and *0.0375. e The MDA adducts were measured by ELISA in HDL isolated from control or FH subjects pre- and post-LDL apheresis. n = 7 biologically independent humans per group. Data are presented as mean ± SEM. One-way ANOVA with Bonferroni’s post hoc test, p values of control vs FH pre LDL apheresis and control vs FH post-LDL apheresis are ***<0.0001. f The MDA-Lysyl crosslink content in HDL from control or FH subjects. n = 6 biologically independent humans per group. Data are presented as mean ± SEM. Two-sided unpaired t test, p value of control vs FH-HDL is ***0.0002. g The capacity of HDL from control or FH subjects pre- and post-LDL apheresis to reduce the cholesterol content of apoE−/− macrophages. n = 7 biologically independent humans per group. Data are presented as mean ± SEM. One-way ANOVA with Bonferroni’s post hoc test, p values of control vs pre LDL apheresis and control vs post-LDL apheresis are ***<0.0001. Source data are provided as a source data file.

