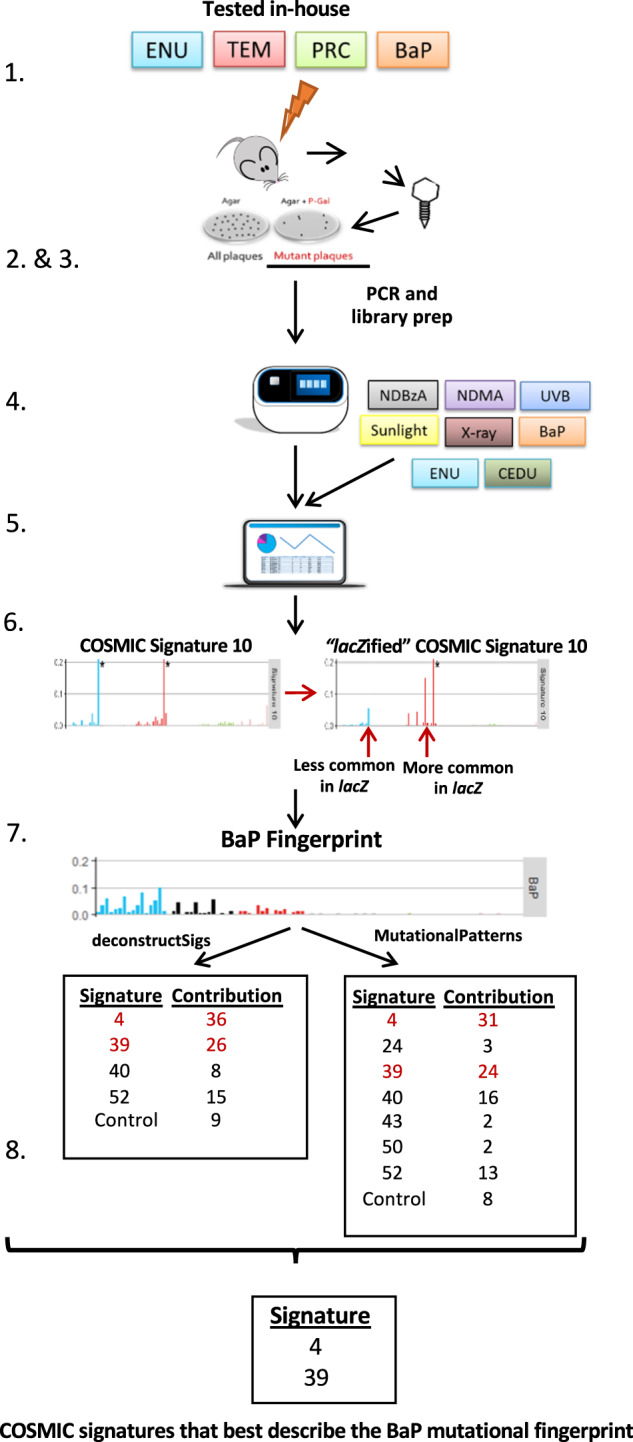
Fig. 1. Experimental design.

The experimental workflow included: animal exposure and determination of mutant frequencies (steps 1–2); sequencing of collected plaques and collection of published lacZ sequenced data (steps 3–4); generation of mutation profiles (steps 5–6); and query of the COSMIC database to identify mutational signatures that contributed to the mutation profile of tested agents (steps 7–8). The steps are detailed here and numbered as in the figure: (1) Four chemicals were tested in-house against solvent controls using the TGR in vivo mutagenicity assay. (2) Mutant plaques from controls and chemical-exposed mice were collected and pooled per individual. (3) Mutant plaques were PCR amplified as two technical replicates, library prepped and sequenced on the Ion Proton Platform. SNVs were called and corrected for clonal expansion. (4) Published Sanger sequencing data were compiled for eight additional mutagens, plus controls, tested using the lacZ plasmid or MutaMouse mice. (5) All sequencing data (Sanger and Ion Proton) were imported into the R console and trinucleotide mutation context were obtained using the “mutationContext” function. (6) To compare human COSMIC signatures and lacZ mutation data, the COSMIC signatures were normalized to lacZ trinucleotide frequencies and each of the 96 trinucleotide substitutions were represented as relative frequency. (7) The “deconstructSigs” and “MutationalPatterns” packages were used in parallel to identify COSMIC signatures that best describe the mutational fingerprint of mutagen exposure. (8) High confidence signatures were selected as those that: (i) were detected by both “deconstructSigs” and “MutationalPatterns”; (ii) contributed at least 20%; (iii) had a cosine similarity of 0.5 or higher with the mutational fingerprint.
