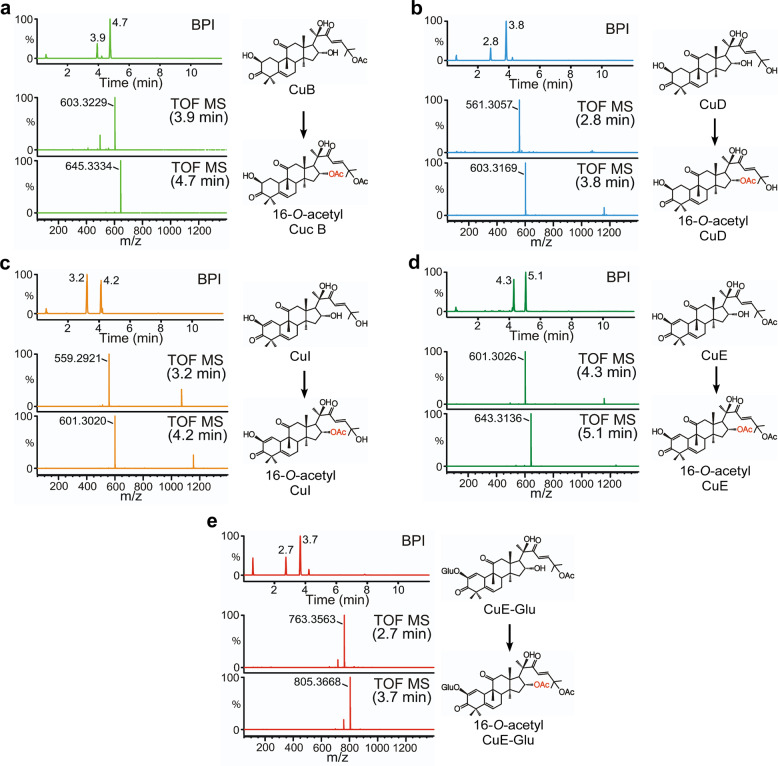
Fig. 1. ACT3 catalytic activity in the biosynthesis of new compounds.
a LC-MS analysis of ACT3 enzymatic reaction using CuB as a substrate. The base peak intensity (BPI) chromatogram in negative-ion mode shows peaks at retention times (RT) of 3.9 and 4.7 min Peaks in the extracted ion chromatogram at a mass/charge ratio (m/z) of 603.3229 [M+formic acid (FA)-H]− and 645.3334 [M+FA-H]− correspond to CuB and 16-O-acetyl CuB, respectively. b LC-MS analysis of ACT3 enzymatic reaction using CuD as a substrate. The BPI chromatogram in negative-ion mode shows peaks at 2.8 and 3.8 min. Peaks in the extracted ion chromatogram at m/z 561.3057 [M+FA-H]− and 603.3169 [M+FA-H]− correspond to CuD and 16-O-acetyl CuD, respectively. c LC-MS analysis of ACT3 enzymatic reaction using CuI as a substrate. The BPI chromatogram in negative-ion mode shows peaks at 3.2 and 4.2 min. Peaks in the extracted ion chromatogram at m/z 559.2921 [M+FA-H]− and 601.3020 [M+FA-H]− correspond to CuI and 16-O-acetyl CuI, respectively. d LC-MS analysis of ACT3 enzymatic reaction using CuE as a substrate. The BPI chromatogram in negative-ion mode shows peaks at 4.3 and 5.1 min. Peaks in the extracted ion chromatogram at m/z 601.3026 [M+FA-H]− and 643.3136 [M+FA-H]− correspond to CuE and 16-O-acetyl CuE, respectively. e LC-MS analysis of ACT3 enzymatic reaction using CuE-Glu as a substrate. The BPI chromatogram in negative-ion mode shows peaks at 2.7 and 3.7 min. Peaks in the extracted ion chromatogram at m/z 763.3563 [M+FA-H]− and 805.3668 [M+FA-H]− correspond to CuE-Glu and 16-O-acetyl CuE-Glu, respectively. The structure of the product (right) was elucidated using LC-MS and NMR spectroscopy. Error bars denote ± standard deviation (SD), n = 3.

