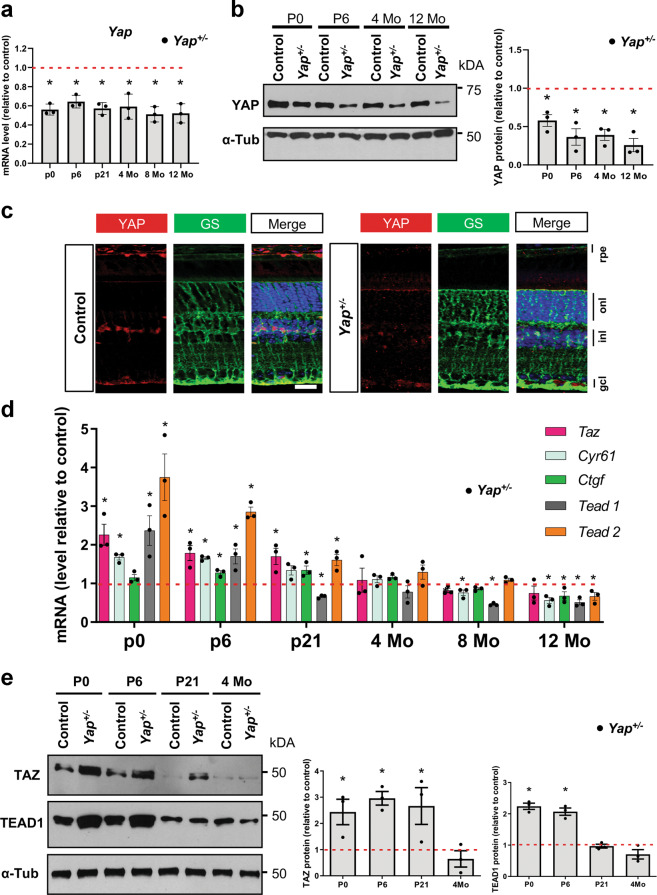
Fig. 1. Compensatory regulation in Yap+/− mice.
a RT-qPCR analysis of Yap expression in Yap+/− mice retina, relative to wild-type controls (dashed line) (n = 3 biological replicates per condition). b Analysis of YAP protein expression level by western blot. The quantification is normalised to α-tubulin (α-Tub) signal and relative to wild-type controls at each stage (dashed line) (n = 3 biological replicates per condition). c 4-month-old mice retinal sections immunostained for YAP (red) and a marker of Müller cells, glutamine synthetase (GS, green). Nuclei are DAPI counterstained (blue). d RT-qPCR analysis of Taz, Cyr61, Ctgf, Tead1, and Tead2 expression relative to wild-type controls (dashed line) (n = 3 biological replicates per condition). e Western blots analysis of TAZ and TEAD1. The quantification is normalised to α-tubulin (α-Tub) signal and relative to controls at each stage (dashed line) (n = 3 biological replicates per condition). rpe: retinal pigment epithelium, inl: inner nuclear layer, onl: outer nuclear layer, gcl: ganglion cell layer. All values are expressed as the mean ± SEM. Statistics: Mann–Whitney test, *p ≤ 0.05. Scale bar: 20 µm.

