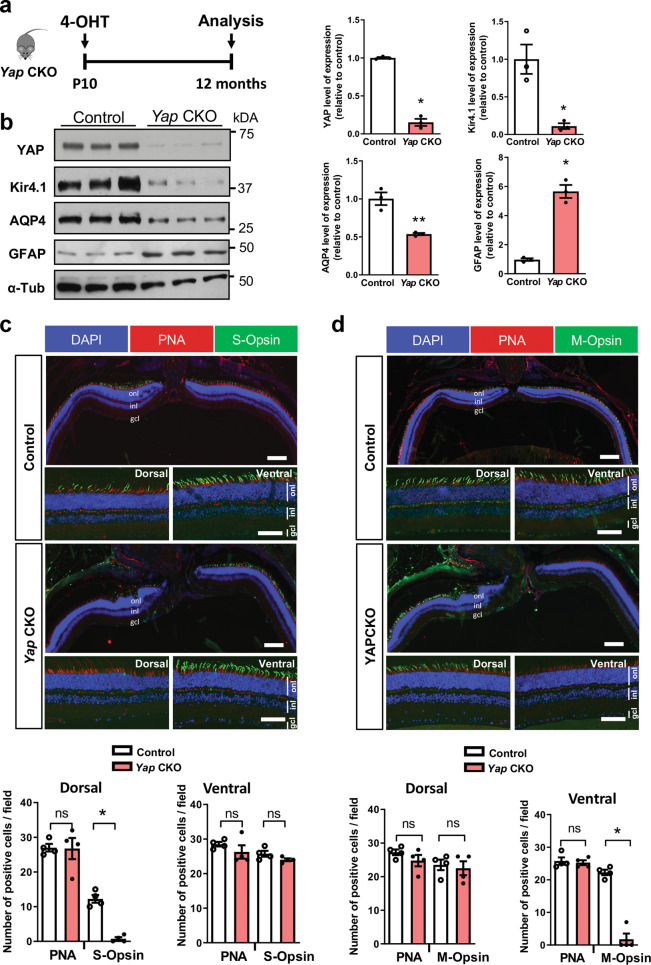
Fig. 7. Müller cell dysfunction and decreased expression of S/M-opsin in Yap CKO.
a Timeline diagram of the experimental procedure used in b. Yapflox/flox mice (control) and Yapflox/flox;Rax-CreERT2 mice (Yap CKO) received a single dose of 4-OHT at P10 and their retinas were analyzed at 12 months. b Analysis of the protein expression level of AQP4, Kir4.1, and GFAP. Results are normalised to α-tubulin (α-Tub) signal and expressed relative to control (n = 3 biological replicates per condition). c, d Retinal sections from 12-month-old control and Yap CKO mice immunostained for S-opsin (green) and PNA (red) (c) or M-opsin (green) and PNA (red) (d). Dorsal, central and ventral sections of retinal sections are shown. Nuclei are DAPI counterstained (blue). Scatter plots with bars represent the mean number of labelled cells per field (250 × 250 µm) from four retinas per condition. All values are expressed as the mean ± SEM. onl: outer nuclear layer, inl: inner nuclear layer, gcl: ganglion cell layer. Statistics: Mann–Whitney test, *p ≤ 0.05, **p ≤ 0.01, ns nonsignificant. Scale bars: 100 µm (central part) (enlarged panels) and 50 µm (dorsal and ventral part).

