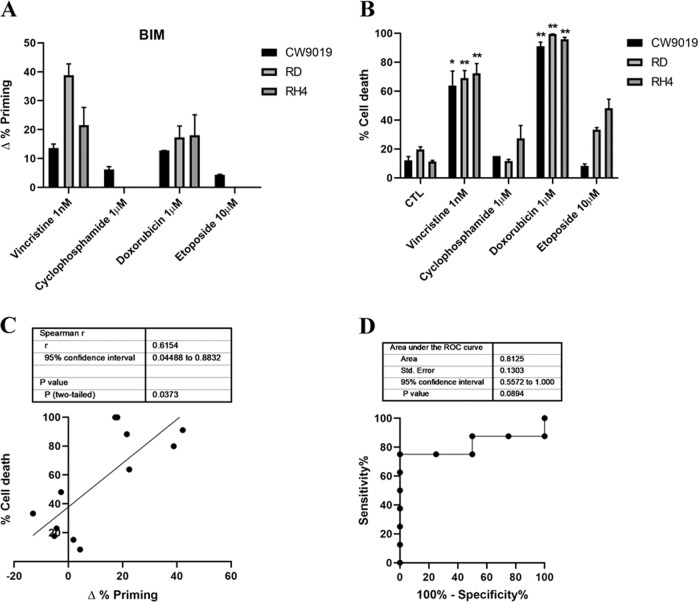
Fig. 1. Dynamic BH3 profiling predicts chemotherapy sensitivity in different RMS cell lines.
a Results from the DBP assay after 36 h incubation with the treatments in CW9019, RD, and RH4 cells. Results expressed as ∆% priming represents the increase in priming compared to control cells. b Cell death results from Annexin V and propidium iodide/DAPI staining FACS analyses after 96 h incubation with the chemotherapeutic agents in CW9019, RD, and RH4 cells. c Correlation between ∆% priming at 36 h and % cell death at 96 h. d Receiver operating characteristic curve analysis. Values indicate mean values ± SEM from at least three independent experiments. **p < 0.01 and *p < 0.05.

