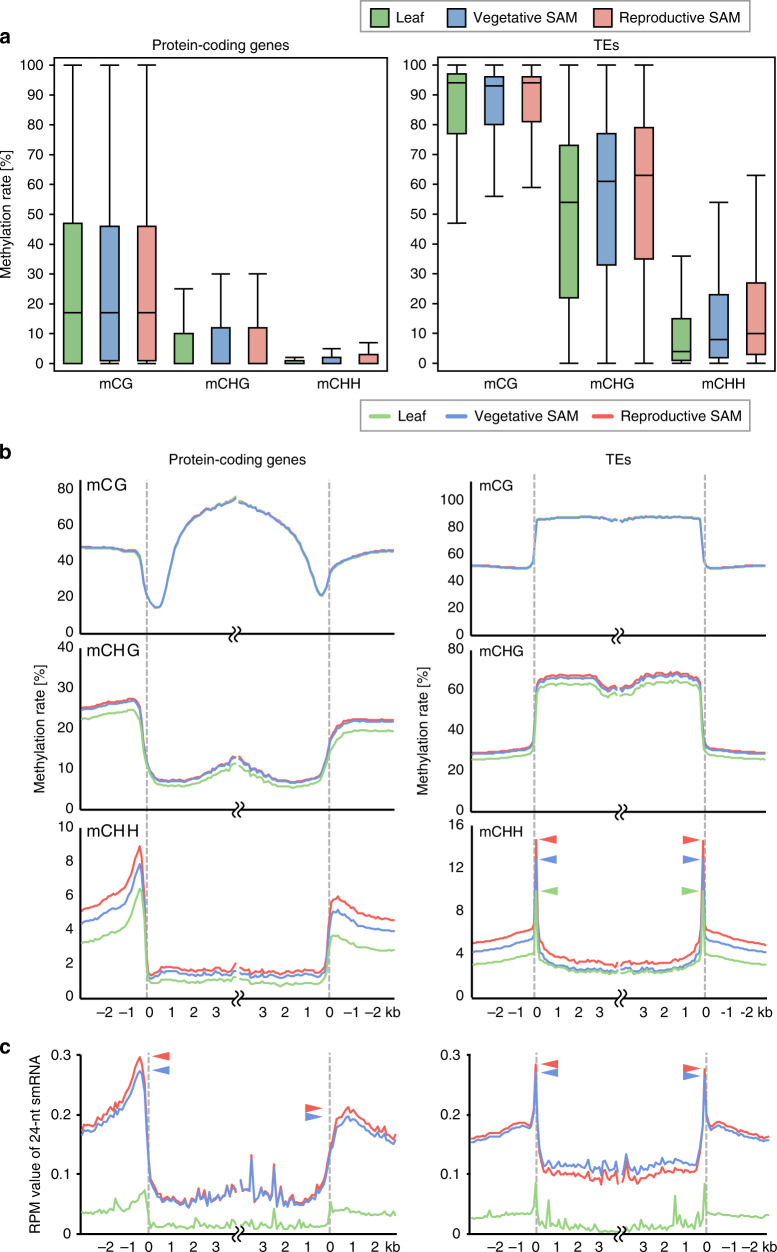
Fig. 2. CHH methylation level varies around both protein-coding genes and TEs.
a Box plots show cytosine methylation levels of bodies of protein-coding genes (left) and TE (right) in mCG, mCHG, and mCHH in mature leaf blade (green), vegetative SAM (blue), and reproductive SAM (red). b Metagene plots show patterns of DNA methylation for each context in mature leaf blade (green), vegetative SAM (blue), and reproductive SAM (red). Protein-coding genes (left) or TEs (right) were aligned at the 5′ end or the 3′ end and average methylation level for CG (top), CHG (middle), and CHH (bottom) contexts was plotted. Methylation level within each 100-bp window was averaged and plotted from 3 kb away from the protein-coding genes or TEs (negative numbers) to 4 kb into the annotated regions (positive numbers). Dashed lines represent the points of alignment. Arrowheads indicate the peaks at the edges of TE bodies. c Patterns of 24-nt small RNA expression in mature leaf blade (green), vegetative SAM (blue), and reproductive SAM (red) around protein-coding genes (left) and TEs (right). Protein-coding genes or TEs were aligned at the 5′ end or the 3′ end and average RPM values for smRNAs within 100-bp windows were plotted from 3 kb away from the protein-coding genes or TEs (negative numbers) to 4 kb into the annotated regions (positive numbers). Dashed lines represent the points of alignment. Arrowheads indicate the peaks around protein-coding genes and at the edges of TE bodies.

