Figure 5.
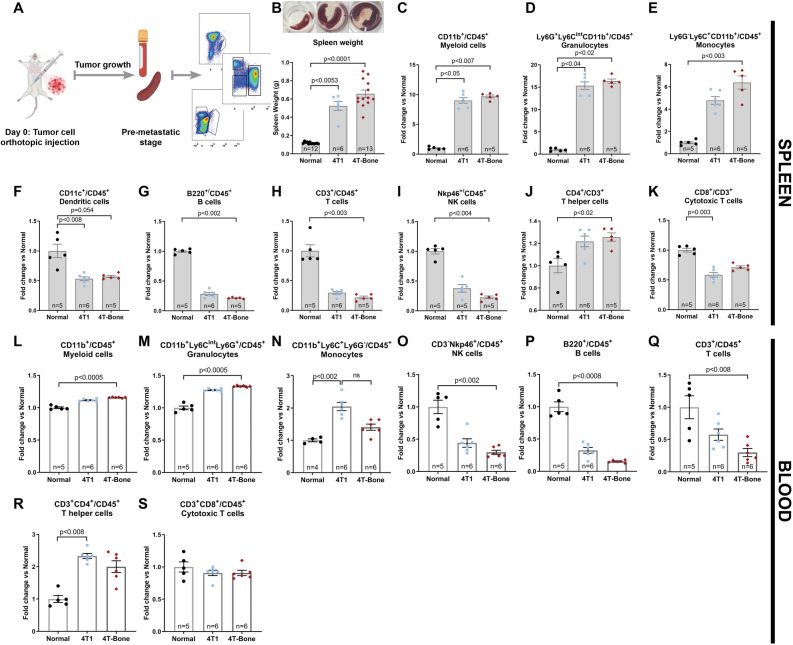
Breast cancer metastasis is associated with systemic inflammation and immunosuppression. (A) Scheme of the experimental design. This scheme was designed by using graphical elements from BioRender. (B) Representative images of spleens of normal, 4T1-injected and 4T-Bone-injected mice at pre-met stage. (C) Spleen weight showing severe splenomegaly in 4T1 and 4T-Bone injected mice. (C–K) FACS analysis results of major immune cell populations in spleens. (C) CD45+CD11b+CD11c− total myeloid cell population. (D) CD45+CD11c−CD11b+Ly6G+Ly6Cint granulocytes. (E) CD45+CD11c−CD11b+Ly6G−Ly6C+ monocytes. (F) CD45+CD11b−CD11c+ dendritic cells. (G) CD45+CD3−B220+ B cells. (H) CD45+B220−CD3+ T cells. (I) CD45+B220−CD3−Nkp46+ NK cells. (J) CD45+B220−CD3+CD4+ T helper cells. (K) CD45+B220−CD3+CD8+ cytotoxic T cells. (L–S) FACS analysis results of circulating immune cells in the blood of normal, 4T1-injected and 4T-Bone-injected mice. Number of mice per each group is specified in graphs. Data are presented as % of CD45, normalized to the average of normal group. Error bars represent SEM. p < 0.05; Kruskal–Wallis multiple comparison test.

