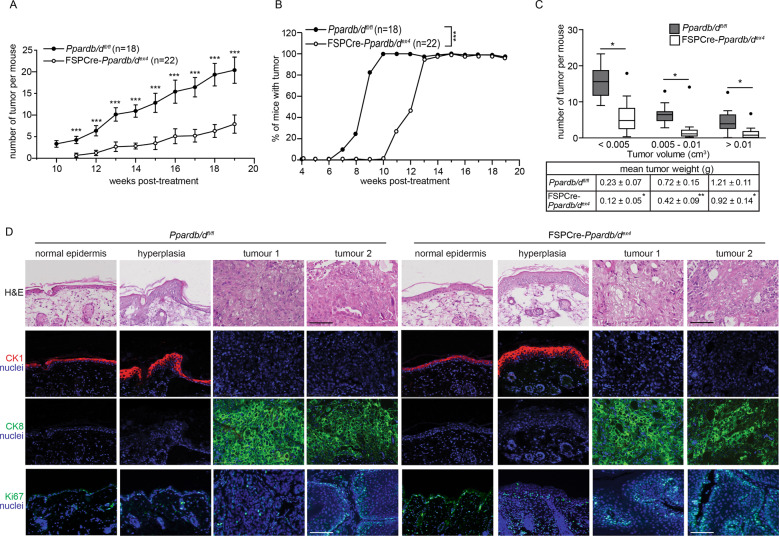
Fig. 1. Reduced skin tumor load in FSPCre-Pparb/dex4 mice.
a Graph showing the mean number of tumors in FSPCre-Pparb/dex4 (open circle) and Pparb/dfl/fl (solid circle) mice starting from week 10 post tumor initiation. b Graph showing the percentage of FSPCre-Pparb/dex4 (open circle) and Pparb/dfl/fl (solid circle) mice that developed palpable tumors after chemical-induced skin carcinogenesis. The duration of tumor emergence in FSPCre-Pparb/dex4 (median = 12.5 weeks) and Pparb/dfl/fl (median = 9 weeks) mice was evaluated with the log-rank test. ***p < 0.001. c Box-and-whisker plot showing the distribution of tumor number and size in FSPCre-Pparb/dex4 (white) and Pparb/dfl/fl (gray) mice. Three categories were used for tumor volume classification: small (<5 mm3), medium (5–10 mm3), and large (>10 mm3). Outliers were identified by using the interquartile range and presented as black dots. The table below shows the weight (mean ± s.d.) of the tumors for each category. Data are represented as mean ± s.d. from n = 15–18 mice. *p < 0.05, ***p < 0.001. d Representative images of normal skin, hyperplastic skin, and tumors from FSPCre-Pparb/dex4 and Pparb/dfl/fl mice. Dual immunofluorescence staining was performed for CK1 (red) and CK8 (green). The nuclei were counterstained with DAPI (blue). The same sections were used for hematoxylin and eosin (H&E) staining. Proliferation marker Ki67 staining was performed with other sections from the same biopsies. Scale bar: 100 μm.

