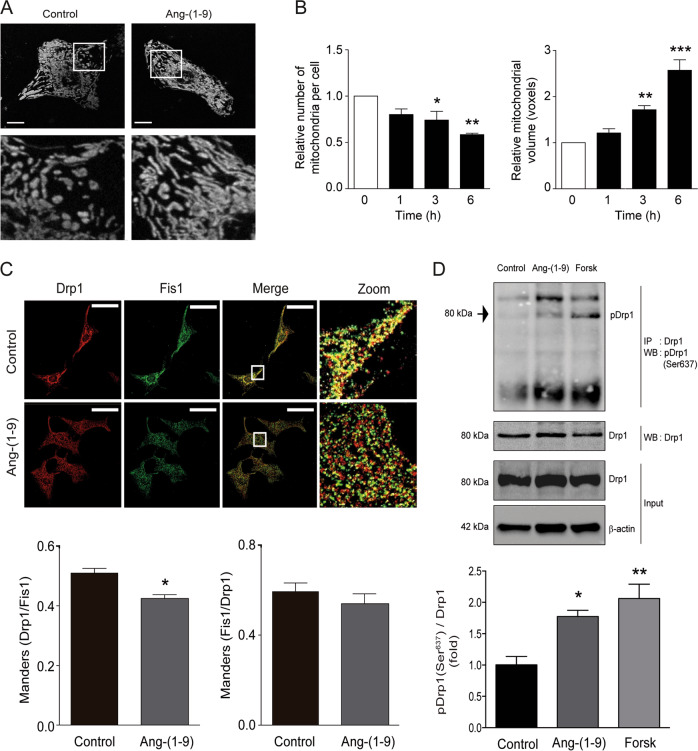
Fig. 1. Angiotensin-(1–9) promotes mitochondrial fusion through Drp1 phosphorylation.
a Mitochondrial morphology of cardiomyocytes stimulated with 100 μM angiotensin-(1–9) for 0–6 h and then loaded with MitoTracker Green (MTG). Z-stack images were obtained with confocal microscopy. Scale bar: 2 μm. Lower panels represent a ×15 magnification. b Quantification of the relative number of mitochondria per cell (left) and the relative mean mitochondrial volume (right) as mitochondrial dynamic parameters in cells treated with 100 μM angiotensin-(1–9) for the indicated times (n = 4), *p < 0.05; **p < 0.01 and ***p < 0.001 vs. 0 h. c Sub-cellular localization of the mitochondrial fission protein Drp1 visualized using immunofluorescence. Cardiomyocytes were stimulated with angiotensin-(1–9) for 6 h, incubated with anti-Drp1 and anti-Fis1 antibodies, and then visualized with confocal microscopy. Scale bar: 10 μm. Right panels represent a ×45 magnification. The Manders’ coefficients of the Drp1 and Fis1 signals were used as indicators of Drp1 localization in the mitochondria (n = 3) *p < 0.05 vs. control. d Drp1 phosphorylation (pDrp1; Ser637) was assessed by western blotting after immunoprecipitation of Drp1 protein. Cells were treated with angiotensin-(1–9) for 6 h or a pulse of 100 nM forskolin for 30 min (positive control for pDrp1). A representative images is shown for three independent experiments with similar outcomes.

