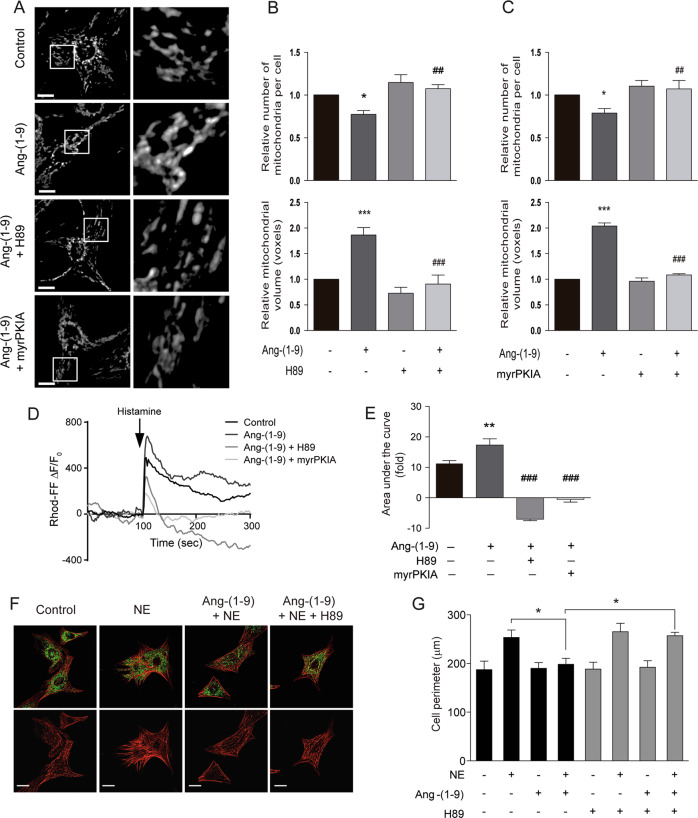
Fig. 6. Inhibition of PKA signaling blunts the effects of angiotensin-(1–9) on mitochondrial dynamics and mitochondrial Ca2+ uptake in cardiomyocytes.
a Confocal MitoTracker Green microscopy images of cardiomyocytes treated with angiotensin-(1–9) (100 μM, 6 h) and the PKA inhibitors H89 (10 μM) or myrPKIA (10 μM). Scale bar: 2 μm. Right panels represent a ×15 magnification. Mitochondrial number and mean mitochondrial volume for each condition were quantified (n = 7 for b and n = 5 for c). d Mitochondrial Ca2+ levels in cells stimulated with angiotensin-(1–9) after pre-treatment with the PKA inhibitors H89 (10 μM) or myrPKIA (10 μM). e Quantification of the area under the curve for Rhod-FF fluorescence (n = 6). f Representative confocal images of cardiomyocytes treated with angiotensin-(1–9) 100 μM for 6 h and/or H89 10 μM and then stimulated with norepinephrine (NE) 10 μM for 24 h. The cells were stained with phalloidine rhodamine to detect sarcomeric structures, and immunolabeled for the mtHsp70 protein to identify mitochondrial network. Scale bar: 25 μm. g Quantitative analysis (n = 3) of cellular perimeter of cells in f. *p < 0.05; **p < 0.01 and ***p < 0.001 vs. control; #p < 0.05; ##p < 0.01 and ###p < 0.001 vs. angiotensin-(1–9).

