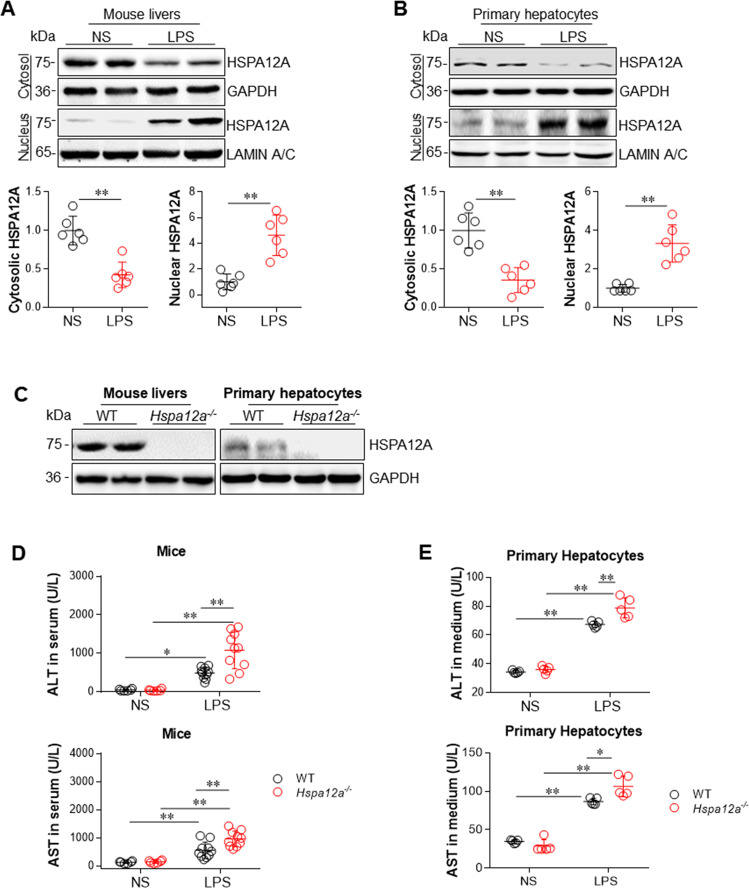
Fig. 1. HSPA12A deficiency promoted the LPS-induced hepatic injury.
a HSPA12A protein expression in livers. Cytosolic and nuclear protein fractions were prepared from mice livers following treatment with LPS or normal saline (NS) for 6 h. HSPA12A expression was analyzed by immunoblotting analysis. Blots for GAPDH or Lamin A/C served as loading controls. Data are mean ± SD, **P < 0.01 by Student’s two-tailed unpaired t test. n = 6/group. b HSPA12A protein expression in primary hepatocytes. Cytosolic and nuclear protein fractions were prepared from primary hepatocytes following incubation with LPS or NS for 6 h. HSPA12A expression was analyzed by immunoblotting analysis. Blots for GAPDH or Lamin A/C served as loading controls. Data are mean ± SD, **P < 0.01 by Student’s two-tailed unpaired t test. n = 6/group. c HSPA12A expression in Hspa12a−/− mice. HSPA12A expression was examined in mice livers and isolated primary hepatocytes using immunoblotting. Note that HSPA12A expression was absent in livers and hepatocytes of Hspa12a−/− mice. n = 10 mice/group. WT, wild type; Hspa12a−/−, HSPA12A knockout. d ALT and AST activities in mouse serum. Mice were treated with LPS or NS for 6 h. Serum was collected for ALT and AST activity measurements. Data are mean ± SD, *P < 0.05 and **P < 0.01 by two-way ANOVA followed by Tukey’s test. n = 6 for each NS group and n = 10 for each LPS group. e ALT and AST activities in culture medium. Primary hepatocytes were incubated with LPS or NS for 6 h. Culture medium was collected for ALT and AST activity measurements. Data are mean ± SD, *P < 0.05 and **P < 0.01 by two-way ANOVA followed by Tukey’s test. n = 5/group.

