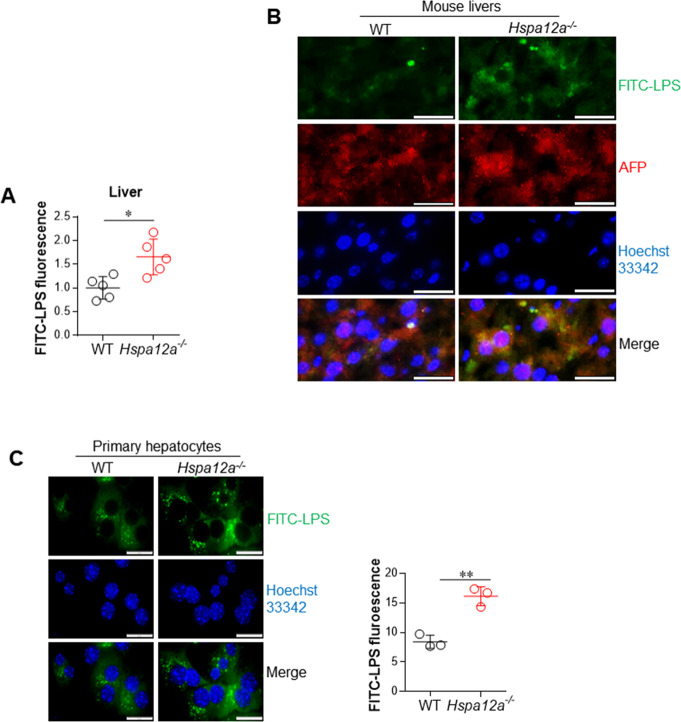
Fig. 2. HSPA12A deficiency increased intra-hepatocyte LPS abundance following LPS exposure.
a LPS contents in liver homogenates. 6 h after FITC-LPS treatment, liver tissues were collected from mice. LPS abundance in liver homogenates (unites/mg tissue, relative) was indicated by the FITC fluorescence intensity that measured by a fluorometer at excitation/emission wavelengths of 490/530 nm. Data are mean ± SD, *P < 0.05 by Student’s two-tailed unpaired t test. n = 5/group. b LPS in cytoplasm of hepatocytes of mouse livers. Frozen liver sections were prepared 6 h after FITC-LPS treatment. The sections were immunostained with alpha-fetoprotein (AFP), and Hoechst33342 was used to counter stain nuclei. Note that more FITC-LPS was present in hepatocyte cytoplasm of Hspa12a−/− mouse livers. Scale bar = 20 μm. n = 4/group. c LPS in cytoplasm of primary hepatocytes. After incubation with FITC-LPS for 6 h, the primary hepatocytes were counter stained with Hoechst33342. The staining was observed and quantified using a fluorescence microscope. Data were expressed as FITC fluorescence intensity *103/mm2 cell area. Data are mean ± SD, **P < 0.01 by Student’s two-tailed unpaired t test. n = 3/group. Scale bar = 20 μm.

