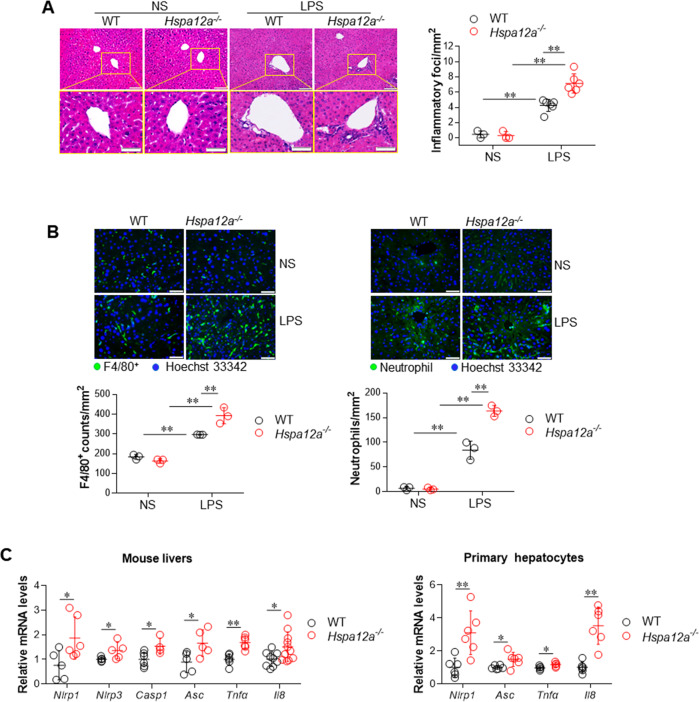
Fig. 4. HSPA12A deficiency promoted the LPS-induced inflammatory response.
Liver tissues were collected from mice 6 h after LPS or normal saline (NS) treatment. Also, cultured primary hepatocytes were collected after LPS incubation for 6 h. The following analysises were performed. a Inflammatory foci. H&E staining was performed on paraffin-embedded section of mouse livers. Inflammatory foci were observed and quantified using a microscope. Data are mean ± SD, **P < 0.01 by two-way ANOVA followed by Tukey’s test. n = 3/NS group and n = 6/LPS group. Scale bar = 100 μm (upper panels) and 50 μm (down panels). b Macrophage and neutrophil recruitments. Immunostaining for F4/80 (macrophage) and neutrophils was performed on frozen sections of mouse livers. Hoechst 33342 was counter stained to visualize nuclei. The staining was observed and quantified using a fluorescence microscope. Data are mean ± SD, **P < 0.01 by two-way ANOVA followed by Tukey’s test. n = 3/group. Scale bar = 50 μm. c Expression of mRNA levels. Levels of the indicated mRNA expression in livers (left panel) and primary hepatocytes (right panel) were evaluated using real-time PCR. Data are mean ± SD, *P < 0.05 and **P < 0.01 by Student’s two-tailed unpaired t test. n = 4–11/group.

