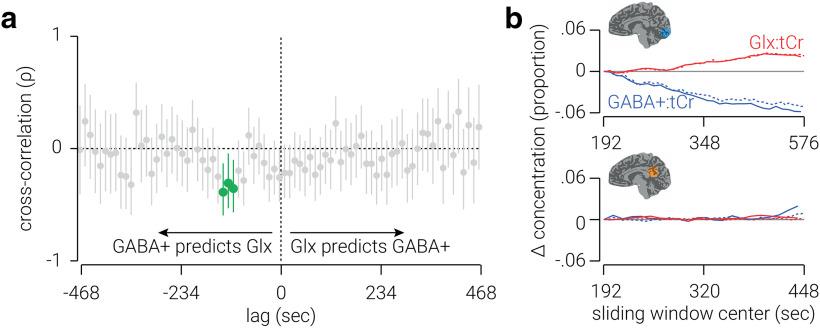
Figure 5.
Controls for high-resolution analyses. a, Cross-correlations between GABA+ and Glx, referenced to tNAA, measured from voxels targeting visual cortex. Vertical lines indicate 95% confidence intervals; cluster-corrected correlations that are significantly different from zero are highlighted in green, correlations at negative lags indicate that GABA+ predicts Glx, and correlations at positive lags indicate that Glx predicts GABA+. b, Comparison between results from the sliding window method used in the low-temporal resolution analysis (dashed lines) and sliding window applied to results from the high-resolution analysis (solid lines) for visual (top) and posterior cingulate (bottom) cortices.

