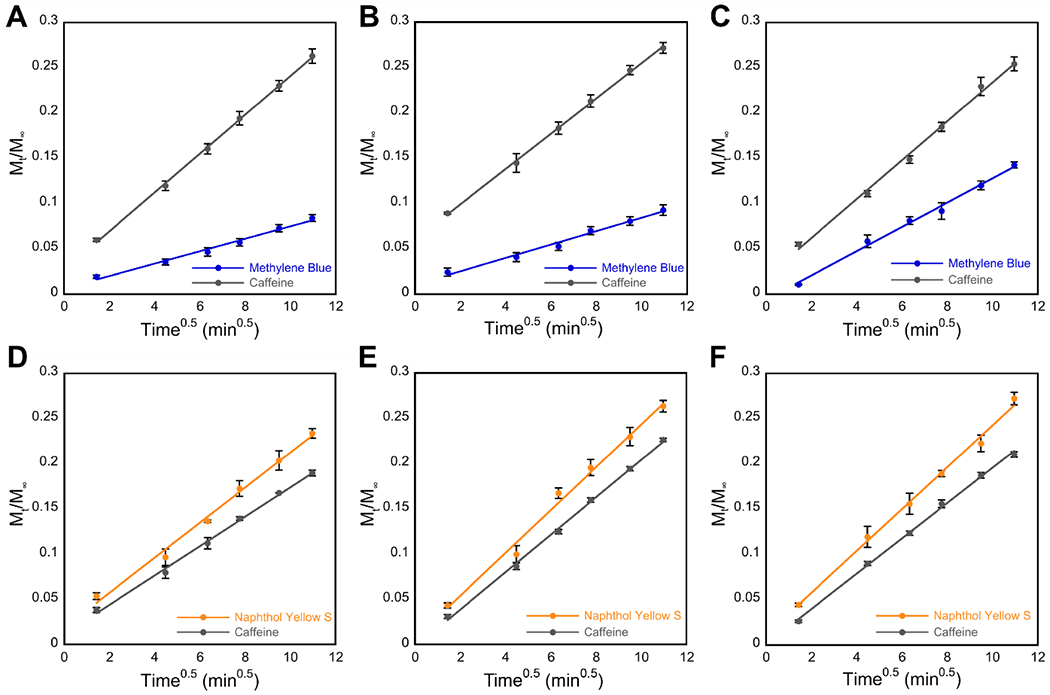
Figure 4.

A linear correlation is observed when Mt/M∞ is plotted against t1/2 during the first 120 minutes of cargo release from hydrogels. The slopes obtained were used to calculate the diffusion coefficients found in Table 2. (A–C) Release of MB (blue) and caffeine (gray) from cationic hydrogels of (A) gelator 1a, (B) gelator 2a, and (C) gelator 3a. (D–F) Release of NY (yellow) and caffeine (gray) from anionic hydrogels of (D) gelator 1b, (E) gelator 2b, and (F) gelator 3b.
