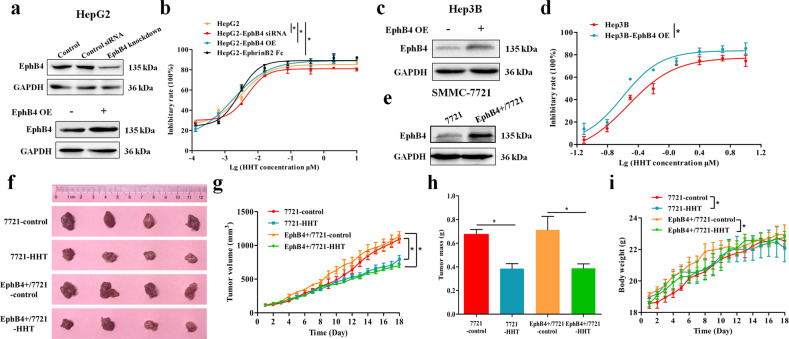
Fig. 2. The inhibitory effect of HHT on HCC cells was associated with EphB4 expression.
a EphB4 expression analysis of EphB4-siRNA or EphB4-overexpression (OE) HepG2 cells. b Effects of HHT on cell proliferation in wild-type, EphB4-siRNA, EphB4-OE, or EphrinB2 Fc stimulated HepG2 cells (n = 5 cultures for each dose). *p < 0.05 compared to the IC50 of HepG2 cells. c EphB4 expression analysis of EphB4-OE Hep3B cells. d Effects of HHT on cell proliferation in wild-type and EphB4-OE Hep3B cells (n = 5 cultures for each dose). *p < 0.05 compared to the IC50 of Hep3B cells. e EphB4 expression analysis of wild-type 7721 and EphB4+/7721 cells. f Photographs of control and HHT-treated group of 7721 tumors and EphB4+/7721 tumors (n = 4 mice). g Tumor volume change throughout the study (n = 4 mice). h Effect of HHT on tumor mass (n = 4 mice). i Body weight of control and HHT-treated group mice (n = 4). g–i data represent mean ± SEM. *p < 0.05 compared to vehicle controls.

