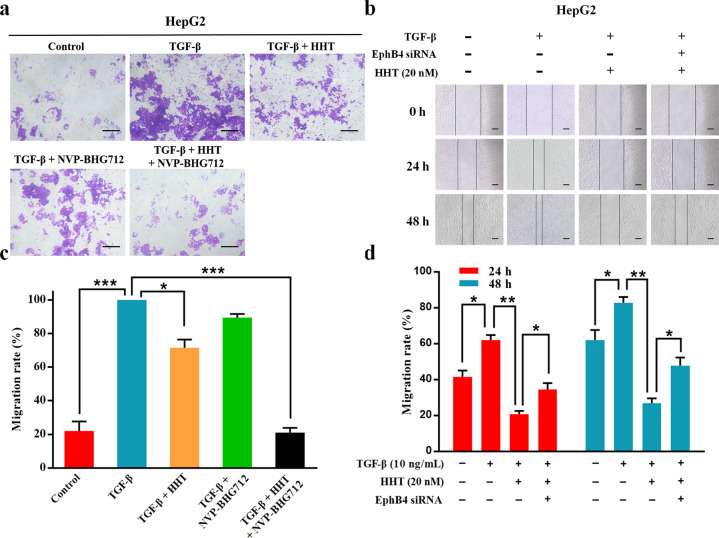
Fig. 4. HHT suppressed HepG2 cell migration induced by TGF-β stimulation.
a Transwell assays were conducted to observe the migratory cells in control and TGF-β, TGF-β + HHT, TGF-β + NVP-BHG712, or TGF-β + HHT + NVP-BHG712 treated HepG2 cells. Scale bars, 100 μm. b The migration rate of control and TGF-β, TGF-β + HHT, or TGF-β + HHT + EphB4 siRNA treated HepG2 cells observed through wound-healing assays. Scale bars, 50 μm. c Quantification of a (n = 5). d Quantification of b (n = 5). All data represent mean ± SEM. *p < 0.05, **p < 0.01, and ***p < 0.001; compared to the indicated groups.

