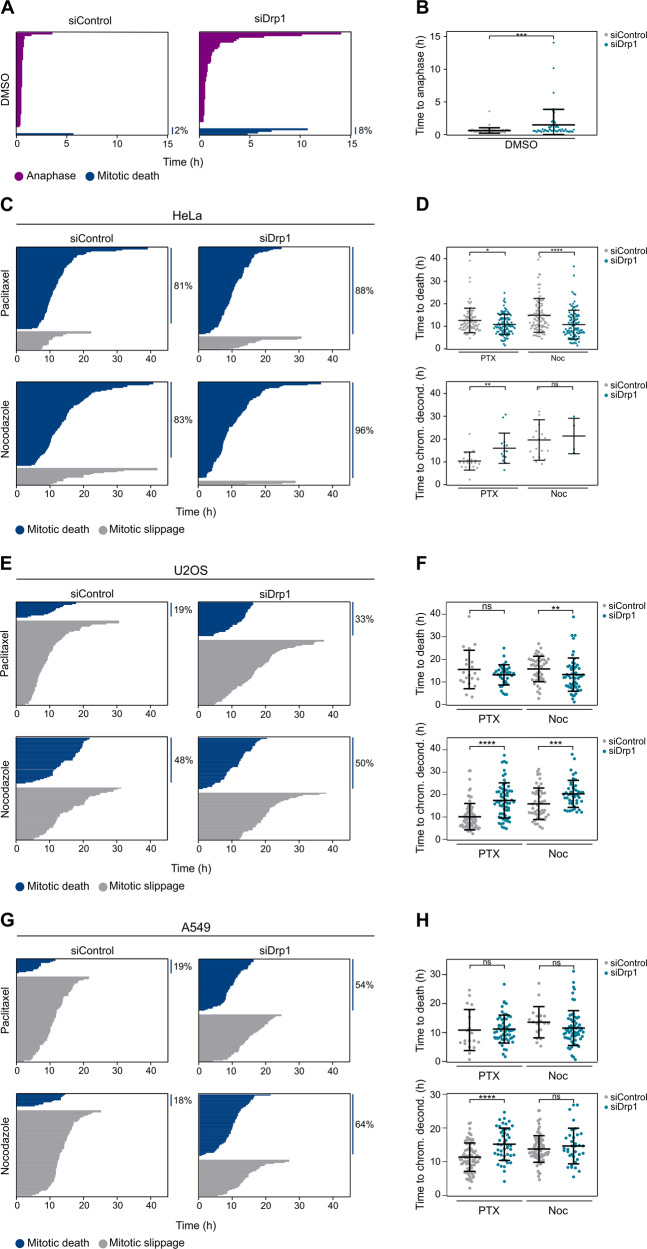
Fig. 5. Drp1 depletion compromises mitotic arrest by accelerating cell death in mitosis.
a Fate profiles of single thymidine-arrested siControl or siDrp1 HeLa cells released into DMSO. Each bar represents the duration of mitosis of one cell. Bar color indicates cell fate. Percentage of cells undergoing mitotic cell death is indicated. At least 50 cells were quantified in each condition. b Box (interquartile range) and whisker (min to max) plots showing the time to anaphase for individual cells after treatment. ***p < 0.001 using Mann–Whitney test. c Fate profiles of single thymidine-arrested siControl or siDrp1 HeLa cells released into PTX or Noc. Each bar represents the duration of mitotic arrest of one cell. Bar color indicates cell fate. Percentage of cells undergoing mitotic cell death is indicated. At least 50 cells were quantified in each condition. d Box (interquartile range) and whisker (min to max) plots showing the time between mitotic entry and mitotic death or slippage for HeLa cells monitored in (c). ****p < 0.0001, **p < 0.001, *p < 0.05, ns no significant using Mann–Whitney test. e Fate profiles of single thymidine-arrested siControl or siDrp1U2OS cells released into PTX or Noc. Each bar represents the duration of mitotic arrest of one cell. Bar color indicates cell fate. Percentage of cells undergoing mitotic cell death is indicated. At least 50 cells were quantified in each condition. f Box (interquartile range) and whisker (min to max) plots showing the time between mitotic entry and mitotic death or slippage for U2OS cells monitored in (e). ***p < 0.0001, **p < 0.001, *p < 0.05, ns no significant using Mann–Whitney test.

