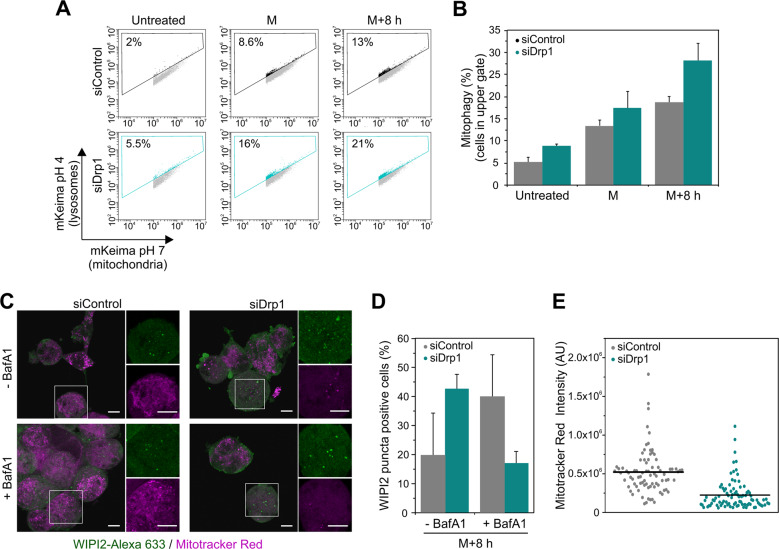
Fig. 6. Mitophagy is enhanced in Drp1-depleted cells during mitotic arrest.
a Mito-mKeima-Red dot plots of siControl (top panels) and siDrp1 (bottom panels) HeLa cells of untreated or cell cycle-arrested cells released in PTX and harvested at M (12 h) or M + 8 h (20 h). Dot plots represent the fluorescence emission of mito-Keima at the mitochondria (x axis) vs. its emission at the lysosomes (y axis) due to the different pH of both organelles. The percentage of cells within the box indicates the rate of mitophagy. b Percentage of mitophagy as displayed in (a). The values represent the mean and the SD of three independent experiments. c siControl (left) and siDrp1 (right) ‘M + 8 h’ HeLa cells were stained with MitoTracker Red CMXRos (magenta) for 1 h. Cells were fixed and immunostained with anti-WIPI2-Alexa Fluor 633 (green) and visualized by confocal microscope. Scale bar, 10 µm. d Quantification of mitotic cells with WIPI2 puncta in siControl and siDrp1 ‘M + 8 h’ HeLa cells as performed in (c). At least 25 cells were quantified per condition in each repetition. Data represent the mean and SD of three independent experiments. e Quantification of Mitotracker Red CMXRos intensity in siControl and siDrp1 ‘M + 8 h’ mitotic HeLa cells as performed in (c). At least 25 cells were quantified per condition in each repetition. Data represent the mean (line) and the individual intensity value for each cell (dots).

