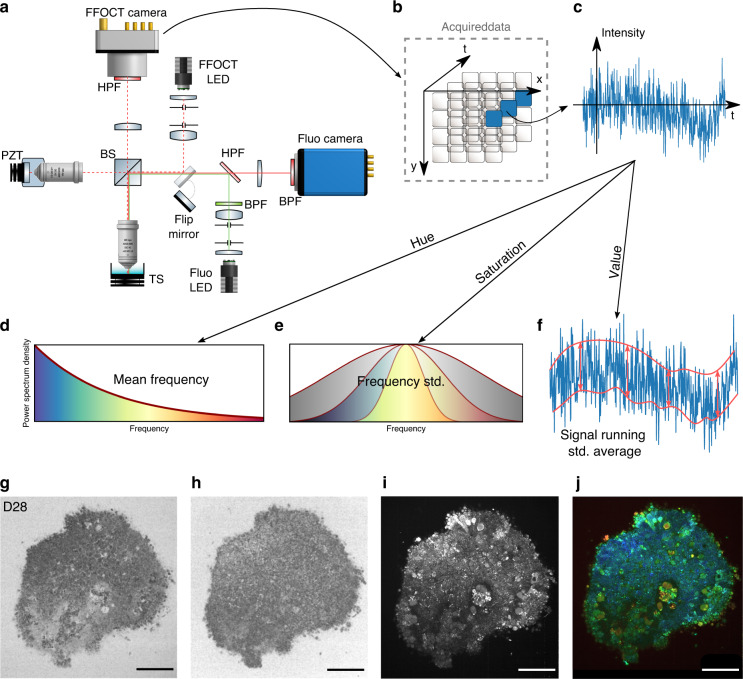
Fig. 1. Experimental setup and post-processing schematic.
Acquisition of images a, Full-field OCT setup combined with wide-field fluorescence microscopy (side view). PZT piezoelectric translation, TS translation stage, BPF bandpass filter, HPF high pass filter. As fluorescence is recorded in the same spectral range as that used for D-FFOCT, D-FFOCT and fluorescence images could not be recorded at the same time; for this purpose, a flip mirror was added to switch from one modality to another. b 3D cube of data (x, y, t) acquired before processing. Each time evolution of a pixel is processed independently. c An intensity trace is plotted for a pixel inside a living retinal organoid. Post-processing steps d–f. Dynamic images are computed in the HSV colour space. d Hue is computed with the mean frequency, from blue (low temporal frequencies) to red (high temporal frequencies). e Saturation is computed as the inverse of the frequency bandwidth; as a consequence, a signal with a broader bandwidth (e.g., white noise) appears dull, whereas a signal with narrow bandwidth appears vivid. f The value is computed as the running standard deviation23. Bottom row is a D29 retinal organoid. g Computation of the mean frequency (hue); h, frequency bandwidth (saturation); and i, dynamic (value) before j, reconstruction. Scale bar: 50 µm

