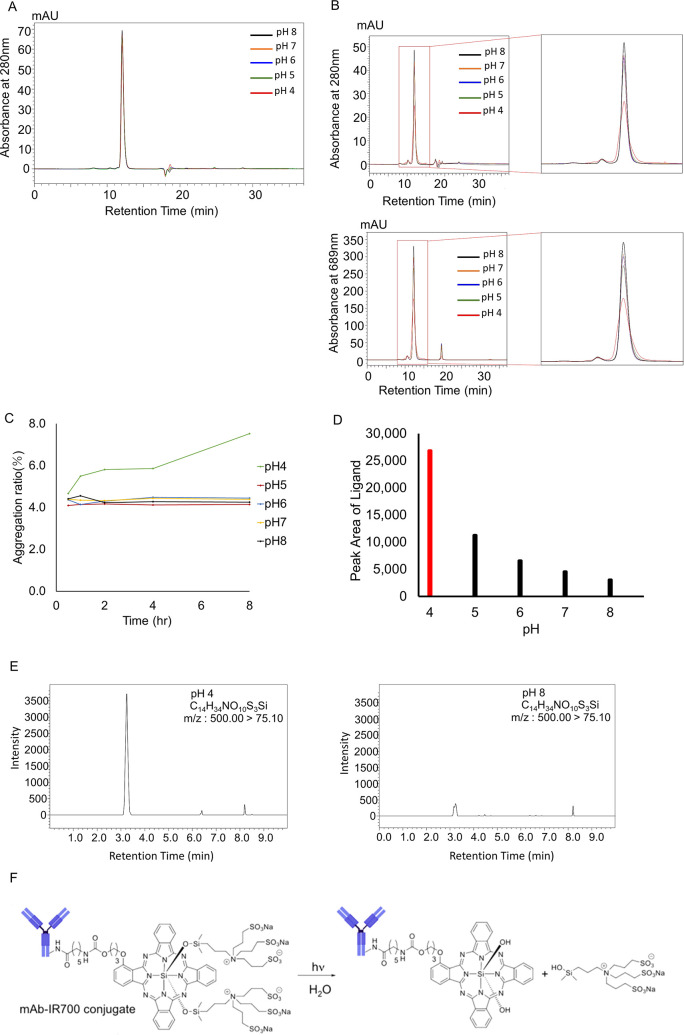
Figure 4.
Effect of solvent pH. (A) SEC chromatograms of panitumumab. No specific changes were visually observed at any pH after incubation for 8 h. (B) SEC chromatograms of Pan–IR700 at 280 nm and 689 nm. An increase in the HMWS peak was observed at pH 4 after incubation for 8 h. (C) Plots of the increase in the amount of aggregation vs incubation time at different pH values. The amount of aggregation increased over time at pH 4. (D) LC/MS/MS detected release of the ligand after incubation for 8 h at pH 4. (E) Ligand peak intensities of samples at different pH after incubation for 8 h. The ligand peak was significantly higher at pH 4. (F) Hypothesized change of chemical structure of Pan–IR700 under acidic conditions.

