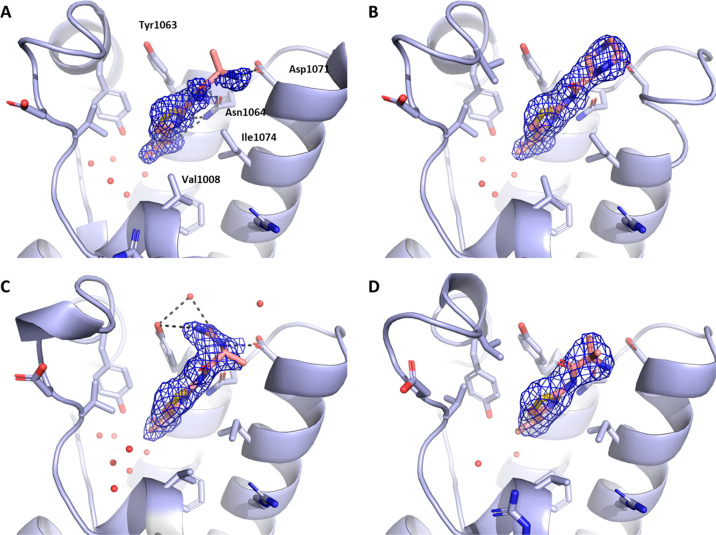
Figure 1.
(A–D) Crystal structures of the ATAD2 bromodomain in the complex with compounds 1–4. 2Fo–Fc electron density maps are shown in blue. In all figures, conserved water molecules and water molecules involved in bridging polar interactions (dashed lines) between protein and ligand are shown (red spheres).

