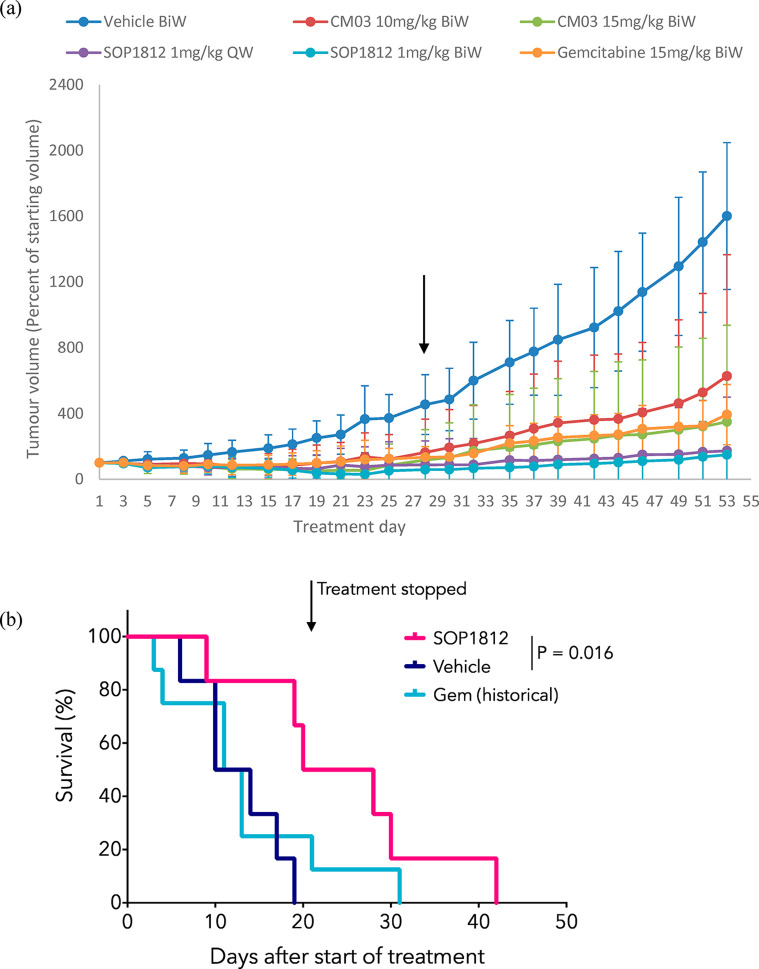
Figure 5.
(a) Antitumor data for the MIA PaCa-2 xenograft model, after 28 days of IV administration, followed by 28 days without treatment. Data are mean ± SD; n = 8 mice to day 28 and n = 4 mice to day 53. The black arrow shows 28 days. QW and BiW represent once-weekly and twice-weekly dosing, respectively. (b) Kaplan–Meier survival curves showing the survival of KPC mice treated with 1 mg/kg IV SOP1812 (n = 6 mice) or control (n = 6 mice) 1× weekly for 3 weeks (4 doses), where possible. Data for mice treated 2× weekly with 100 mg/kg I.P. gemcitabine (n = 8 mice) is also shown. SOP1812 versus vehicle, P = 0.016.

