. 2020 Feb 14;11(2):307–316. doi: 10.1039/d0md00009d

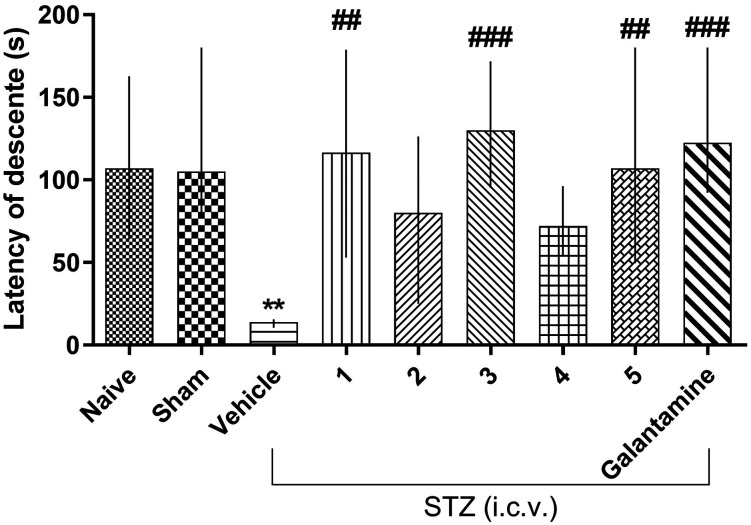
Fig. 4. Effects of compounds 1, 2, 3, 4 and 5 (30 mg kg–1 i.p.) and galantamine (0.5 mg kg–1 i.p.) after inducing AD with STZ on mice tested in the inhibitory avoidance test. Asterisks denote significant differences when compared to the same treatment training and test sessions. Hash symbols denote statistically significant differences when compared to the control (vehicle) in the test session. Each column represents the experiment median followed by the interquartile interval (25–27). The last chart represents the results referring only to the test session and comparing all treatments to the vehicle, and G is the utilized test model representation.

Fig. 4