
Figure 2. Percentage of change in in-person and telehealth outpatient visits during the COVID-19 pandemic, by VA clinic.
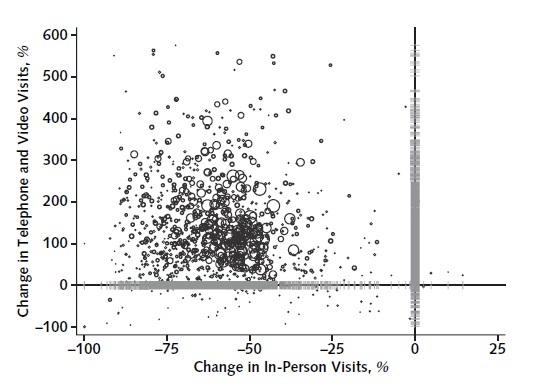
Each circle represents a clinic, and the area of the circle is proportionate to the clinic's size (defined as number of unique patients who visited the clinic during 2019). The horizontal gray lines along the y-axis show the univariate distribution of the percentage of change in telephone and video visits across clinics, and the vertical gray lines along the x-axis show the univariate distribution of the percentage of change in in-person visits across clinics. COVID-19 = coronavirus disease 2019; VA = U.S. Department of Veterans Affairs.